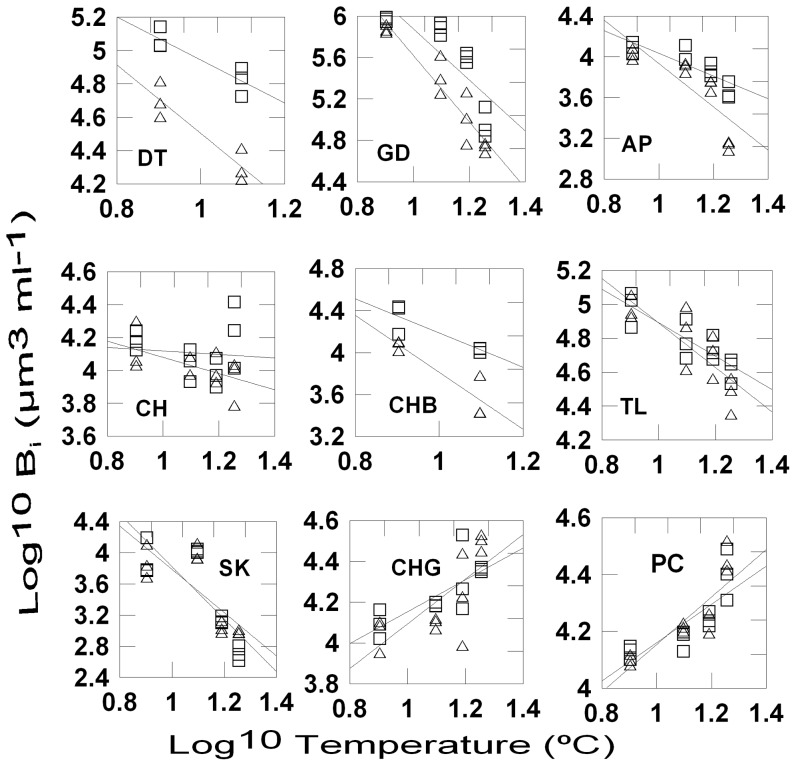
Figure 5. Temperature and grazing effects on the biomass of individual phytoplankton species, experiment 2.
Regressions species specific biomass (log10 transformed, µm3ml−1) on temperature (log10 transformed, °C) and grazing regimes (microzooplankton-M: open squares; copepods-C: open triangles); DT: Ditylum brightwellii, GD: Guinaridia delicatula, AP: Amphidinium sp., CH: Chattonella sp., CHB: Chaetoceros brevis, TL: Teleaulax amphioxeia, SK: Skeletonema cf. costatum, CHL: Chaetoceros gracilis; PC: picophytoplankton.

