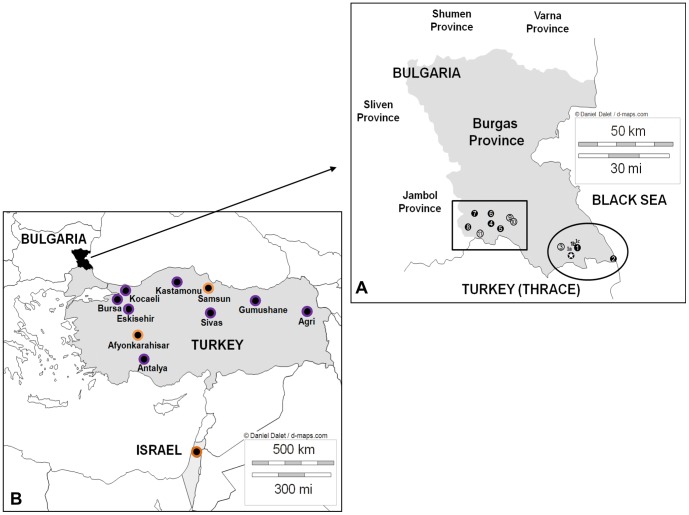
Figure 1. Location of FMDVs sequenced in this study.
A) Map showing the locations of the outbreaks which occurred in Bulgaria during 2011. The two waves of outbreaks are delimited by a circle (1st wave) and a rectangle (2nd wave). Outbreaks are numbered and classified according to the virological status of the collected samples [FMDV-positive (•), and seropositive-only (○)]. The location of the FMDV-positive wild boar is highlighted with a white star. The 3 different sites in outbreak 1 are designated a to c. B) Map showing the sample location of the most closely related Turkish and Israeli FMDVs collected during 2010 (purple-surrounded circles) and 2011 (orange-surrounded circles) which were also included in the study.

