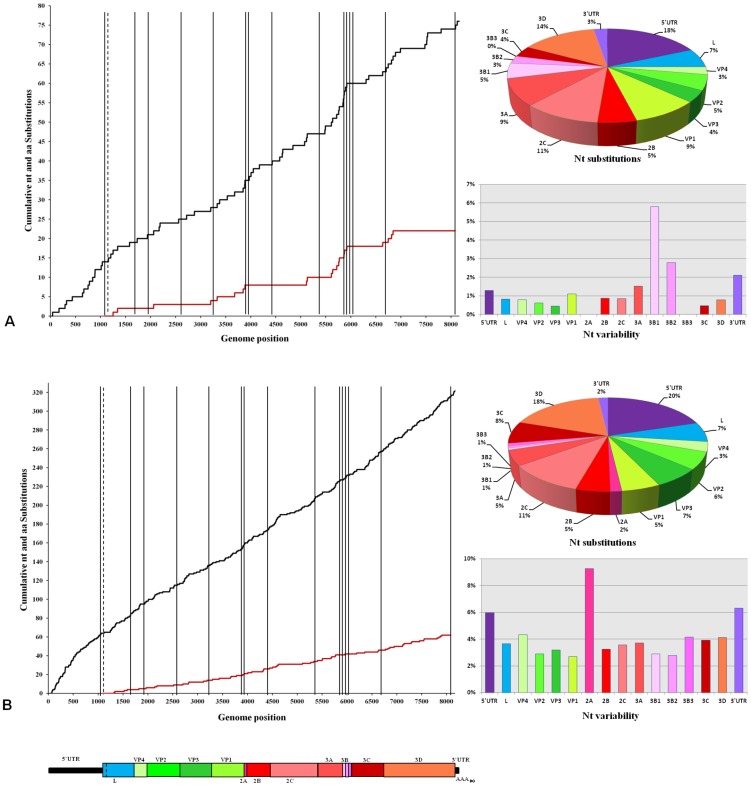
Figure 2. Nucleotide and amino acid substitutions occurring along the genome of the FMDV sequences.
A) Data for sequences from Bulgaria (8 genomes): graphs represent the distribution of total nucleotide (nt) (black line) and non-synonymous (red) substitutions across the different genomic regions of FMDV (shown below). The pie chart and the bar chart show percentage of nt substitutions for each region, and nt variability within the region, respectively. B) Similar analysis to figure 2A) undertaken for the 11 FMDVs genomes from Turkey and Israel.

