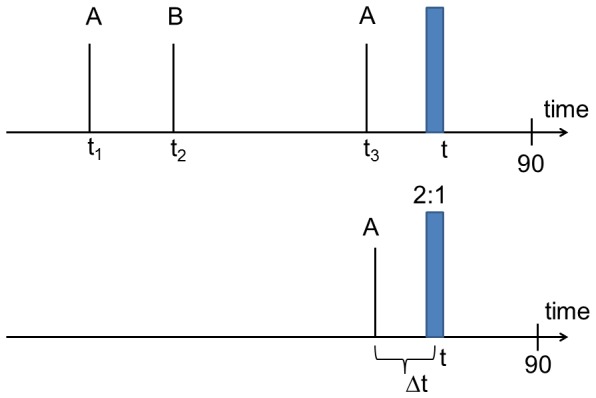
Figure 2. Scheme to describe the general statistical approach.

Upper row: the complete information about the goals for a specific example which contribute to the prediction of the goal rate  at time t. Lower row: the reduced information which takes into account the score at time t as well as the time difference
  to the last goal and the information about the team which scored that goal.
