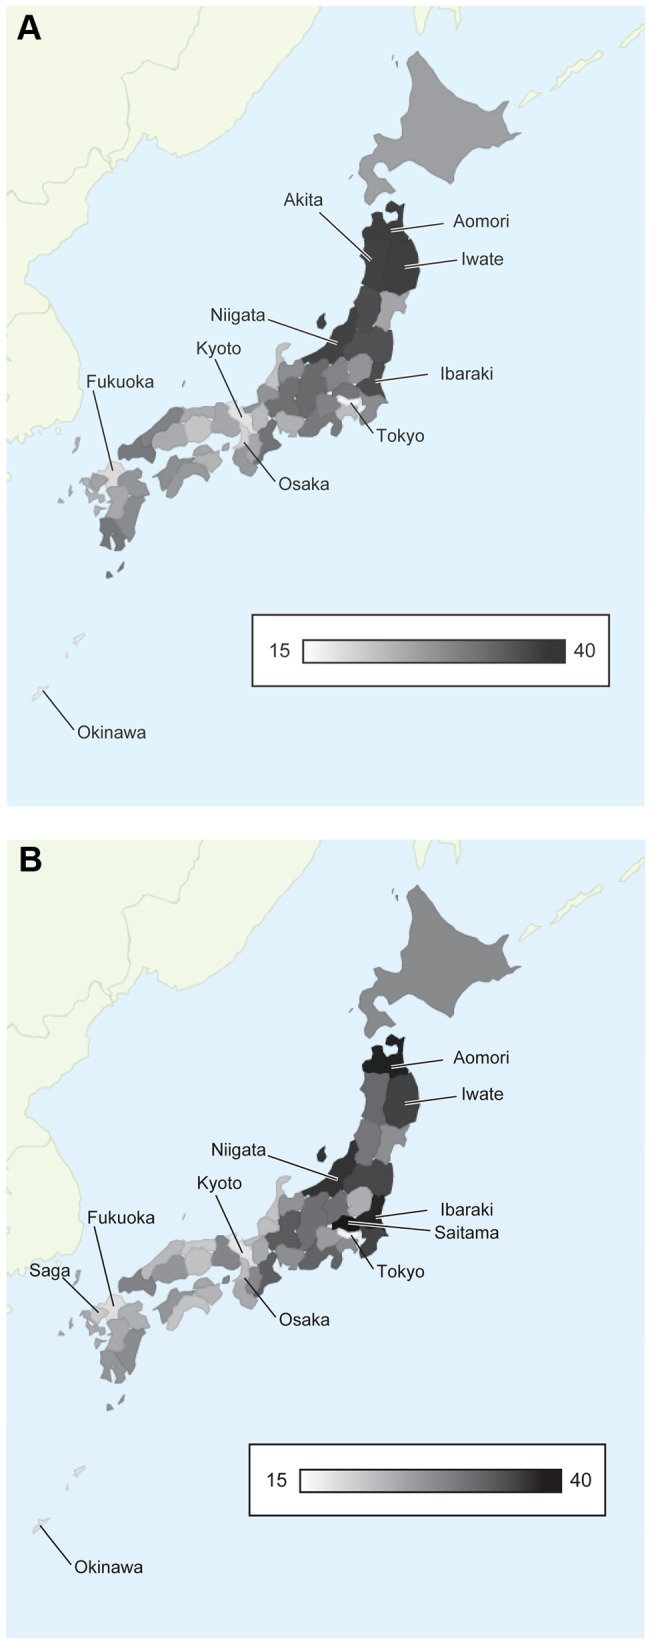
Figure 3. Number of fatalities per practicing physician for the entire population by prefecture.

Values for 2010 are calculated and mapped (panel A). The indicator for all of Japan is 24·0. The best five prefectures are Tokyo (15·8), Okinawa (16·5), Kyoto (17·7), Fukuoka (18·2), and Osaka (19·1). The worst five prefectures are Aomori (35·2), Iwate (34·8), Akita (34·3), Niigata (34·2), and Ibaraki (32·7). Values for 2035 are calculated and mapped (panel B). The indicator for all of Japan is 23·1. The best five prefectures are Tokyo (15·7), Kyoto (17·3), Okinawa (17·3), Fukuoka (17·9) and Saga (20·0). The worst five prefectures are Saitama (38·2), Aomori (36·9), Ibraraki (36·1), Niigata (34·1), and Iwate (32·6).
