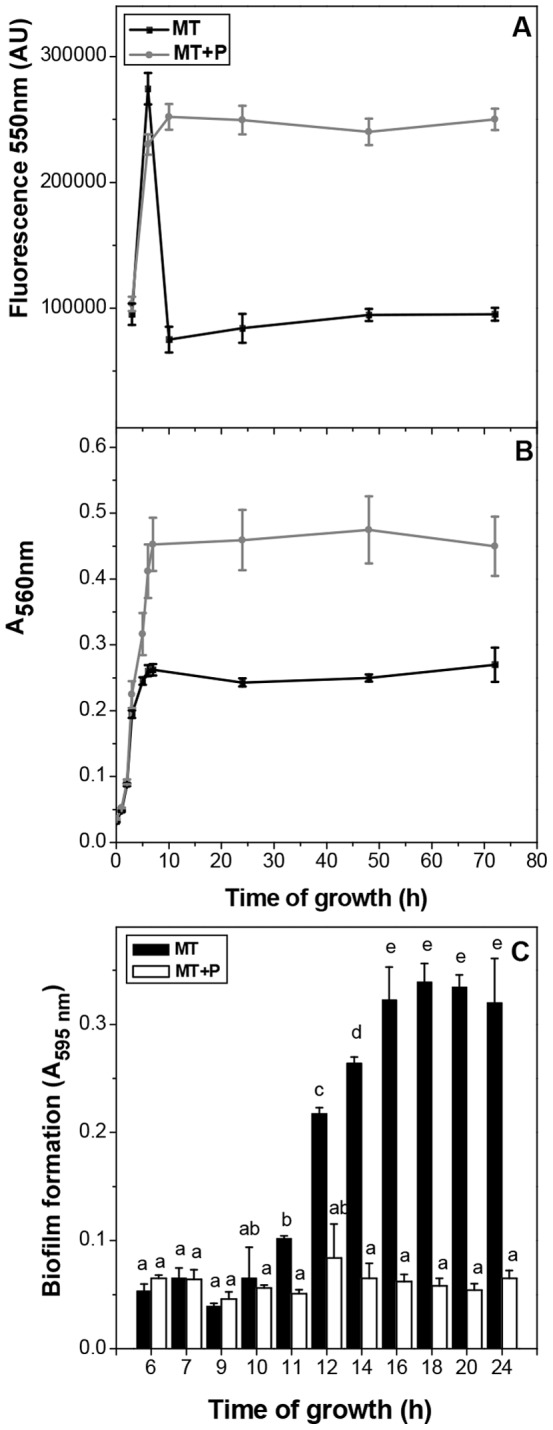
Figure 3. PolyP levels and growth in static cultures.

The fluorescence intensity in arbitrary units (AU) of DAPI-polyP complex (excitation λ = 415 nm, emission λ = 550 nm) (A) and A560 nm (B) were measured during the growth curve of MC4100 in static conditions in the indicated media. Biofilm formation was followed at the indicated times and media (C). Data represent the mean ± SD of at least four independent experiments. Different letters indicate significant differences according to Tukey's test with a p-value of 0.05.
