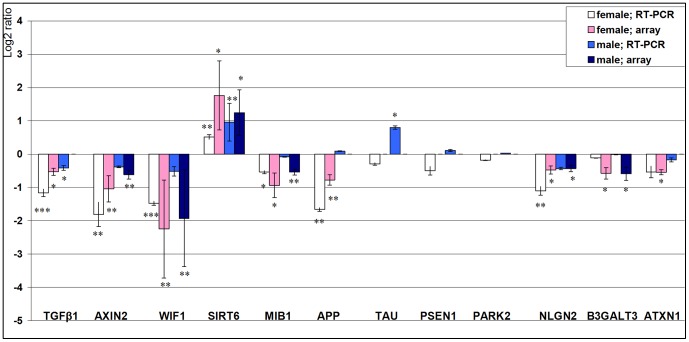
Figure 3. Confirmation of microarray data via real time RT-PCR.
Examination of expression levels of candidate genes: TGFβ, AXIN2, WIF1, SIRT6, MIB1, APP, TAU, PSEN1, PARK2, NLGN2, B3GALT3 and ATXN1 in female and male young and elderly donors. The figure shows the logarithmic ratios aged vs. young with base two (log2) of the selected genes whose expression was deduced by microarray and real-time RT–PCR. A ratio of 1 represents a twofold change with age. Values greater than zero mean higher expression in aged and values less than zero, higher expression in young donors. All experiments have been performed in triplicate. (p<0.05: *, p<0.01:**, p<0.001: ***).

