
Figure 2. Effect of WA on the relative levels of bip, hsp70, hsp30 and eIF1α mRNA.
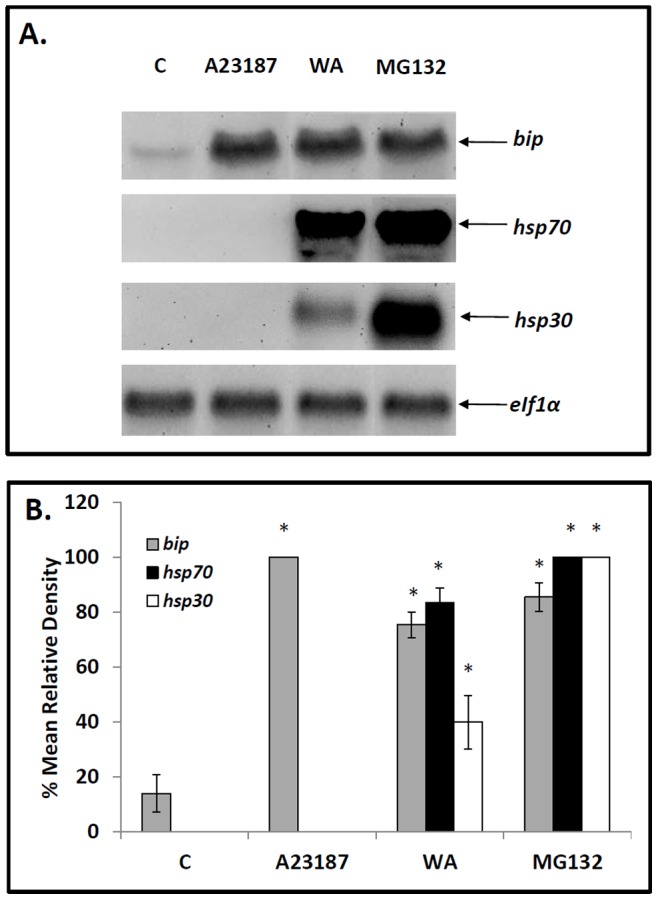
A) Cells were treated with either 5 µM WA for 16 h or 7 µM A23187, 30 µM MG132 or the appropriate volume of the DMSO vehicle (C) for 24 h at 22°C. Cells were harvested and total RNA was isolated. Total RNA (10 µg) was analyzed by northern hybridization analysis using bip, hsp70, hsp30 and eIF1α antisense riboprobes as described in Materials and methods. B) Image J software was used to perform densitometric analysis of the signal intensity for bip (grey), hsp70 (black) and hsp30 (white) mRNA levels of northern blot images as described in Materials and methods. The data are expressed as a percentage of the maximum signal (30 µM MG132 for hsp70 and hsp30 mRNA and 7 µM A23187 for bip mRNA). The standard error is represented by vertical error bars. The level of significance of the differences between samples was calculated by one-way ANOVA with a Tukey’s post-test. Significant differences between the control cells and treated cells are indicated as * (p<0.05). These data are representative of three separate experiments.