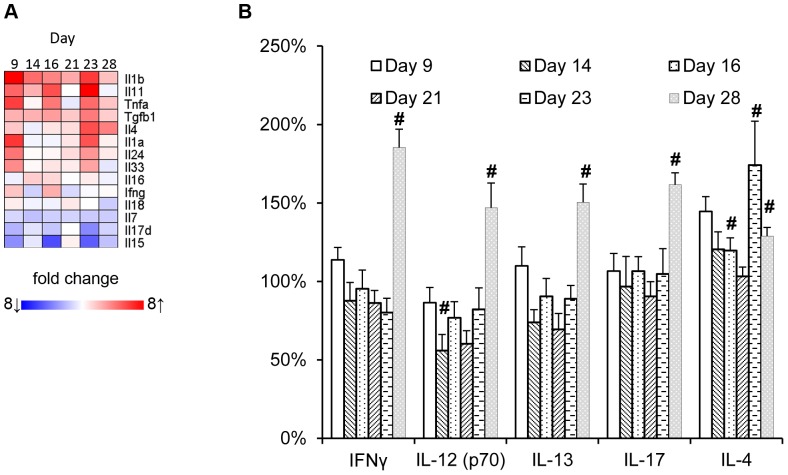
Figure 6. Effect of recurrent TNBS administrations on local and circulating cytokine profiles.
(A) Local mRNA expression of cytokines was determined within the time-course microarray experiment. The size of the effect of TNBS-induced colitis on gene expression in comparison to healthy colons is indicated in a heatmap. These differences are based on mean expression levels of 5 individual animals per time-point. (B) Relative serum concentrations of Th1/Th2/Th17 hallmark cytokines at different time-points during the development of colitis. Concentrations of IFN-γ and IL-12p70, IL-4 and IL-13, and IL-17 are graphically depicted; significant differences are indicated by #.

