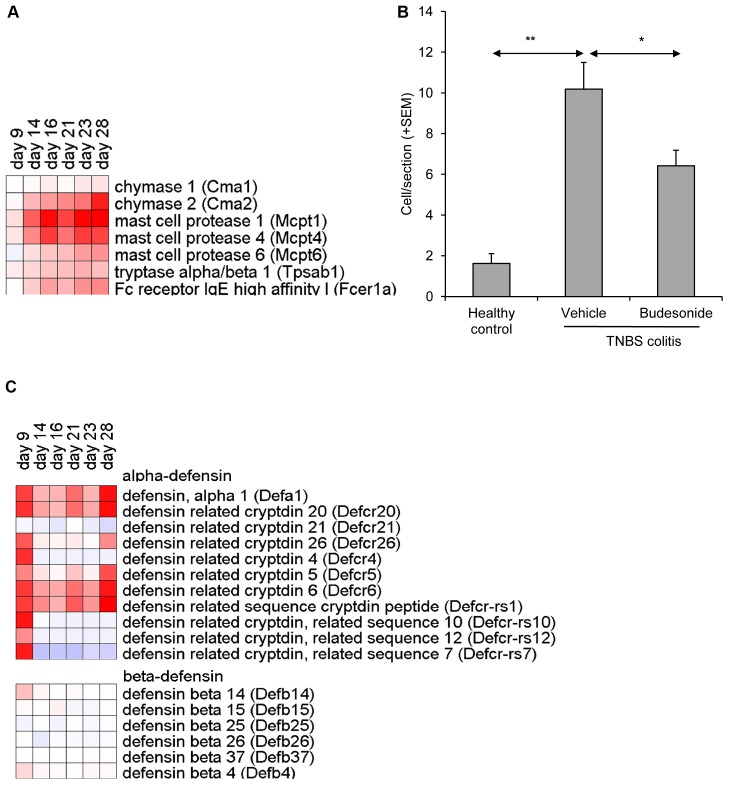
Figure 7. TNBS –induced colitis is associated with increased numbers of mast cells and α-defensins.
(A) mRNA expression of selected mast cell specific genes in affected colon tissue (n = 5/group). Heatmap represents fold changes in TNBS colitis mice as compared to healthy control mice. (B) Quantification of toluidine blue positive cells confirmed TNBS induced up-regulation of mast cells. (C) mRNA expression of α- and β-defensin genes in affected colon tissue.

