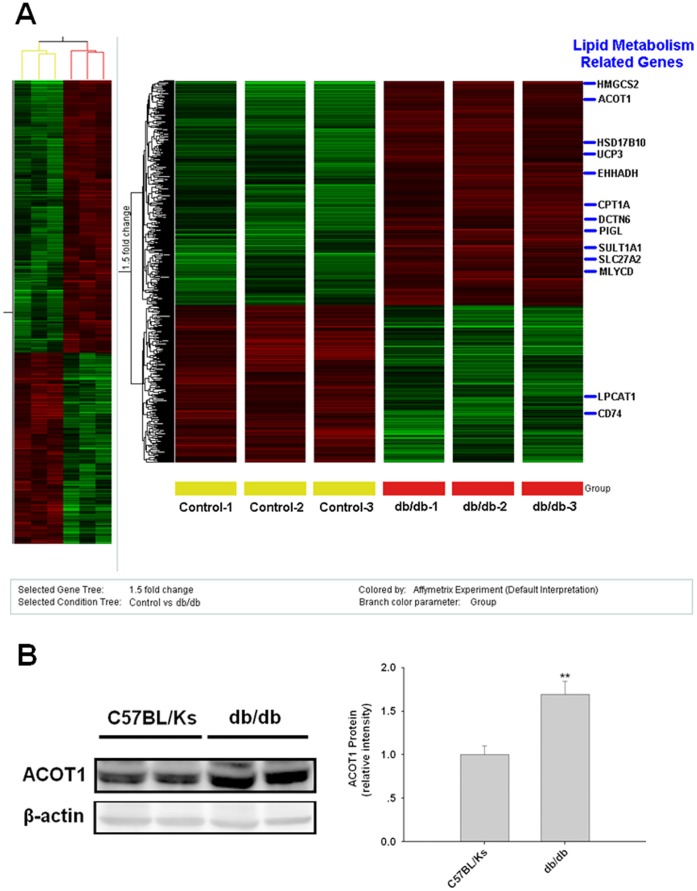
Figure 1. Expression of ACOT1 is upregulated in hearts of db/db mice.
(A) Partial heat map of upregulated and downregulated gene profiles; 6 db/db mice vs 6 control C57BL/Ks mice were examined. Gene expression levels related to cardiac lipid metabolism compared with the control C57BL/Ks mice are labeled. Eleven genes were detected as selectively upregulated, and 2 genes were detected as selectively downregulated. Red indicates high expression and green indicates low expression. (B) Expression of ACOT1 was confirmed by western blot analysis.

