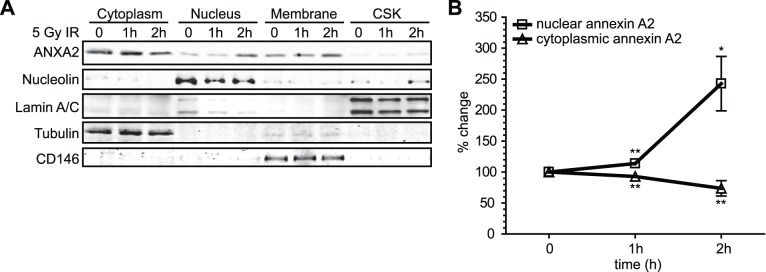
Figure 2. Annexin A2 accumulates in the nucleus and decreases in the cytoplasm in response to genotoxic agents.
(A) TIME cells were not treated (NT) or treated with 5 Gy IR for the times indicated. Cells were fractionated into nuclear, cytoplasmic, membrane and cytoskeletal (CSK) fractions. Identical ratios of the various protein fractions, representing the same percentage of each subcellular fraction, were subjected to SDS-PAGE followed by western blotting with the antibodies indicated. Protein markers for the sub-cellular fractions include: nucleolin (nucleus/cytoskeleton); lamin A/C (nuclear membrane and cytoskeleton); tubulin (cytoplasm); CD146 (plasma membrane). (B) Quantification of the change in annexin A2 protein expression in the nucleus and cytoplasm before and after IR treatment using the Licor Odyssey software. These results represent the average of 4 independent experiments (N = 4). Statistical significance was defined as *P<0.05, **P<0.002, *** P<0.0001. Results are expressed as the mean ± StDev.

