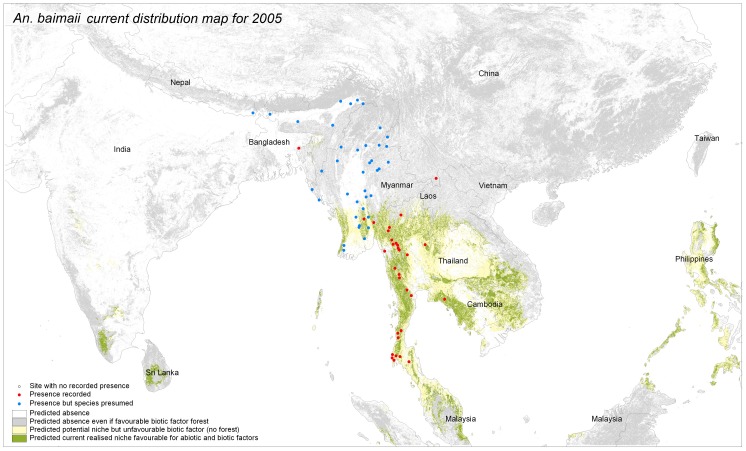
Figure 4. Predicted potential and current distribution area for Anopheles baimaii.
The produced maps show in grey forested areas not suitable according to abiotic factor, in yellow the potential distribution based on abiotic factor but where forest is not present (potential niche) and the distribution as defined by favorable abiotic and biotic factors (“realized” niche). Performance tests for the model include test Gain (1.7), test AUC (0.93) and test extrinsic omission rate based on maximum test sensitivity plus specificity (5.7%).

