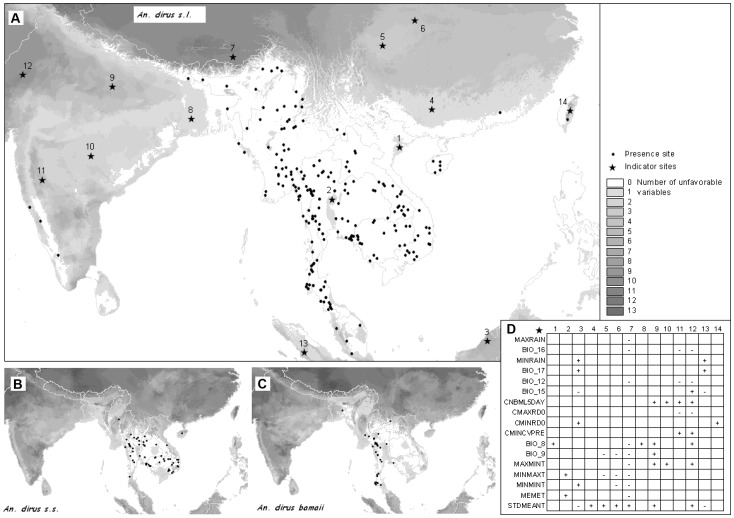
Figure 6. Environmental envelopes.
A) The maps depict the maximum distribution range based on extreme limit values. A graded shade of grey depicts areas with unfavorable value for one or more variables, white being favorable areas for A) Dirus complex, B) An. dirus s.s. and C) An. baimaii. Some sites represented by a star symbol were selected in unfavorable areas. D) A small table analyze if the value is higher (+) or lower (−) to the actual range of value for each variables.

