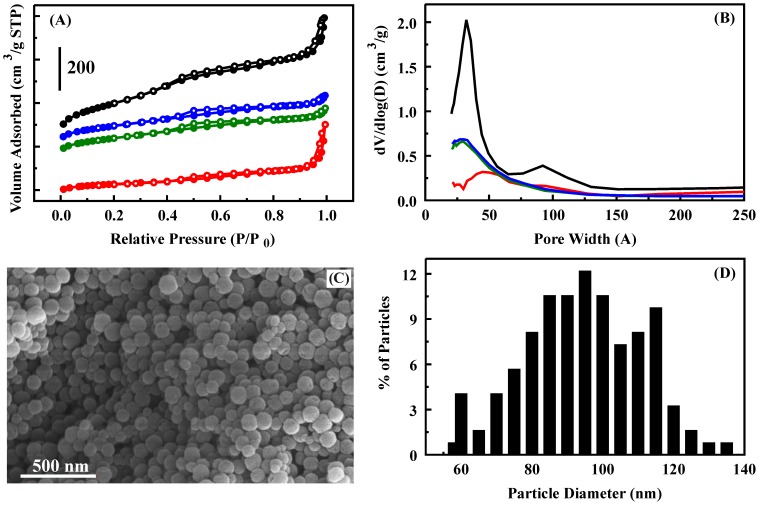
Figure 2. Characterization of nanospherical silicate particles by nitrogen adsorption and SEM imaging: NS (black), NS-G (blue), NS-T (green), and NS-B (red).
A. Nitrogen adsorption/desorption isotherms. B. Pore size distributions. C. SEM image. D. Particle diameter distribution determined from SEM images.

