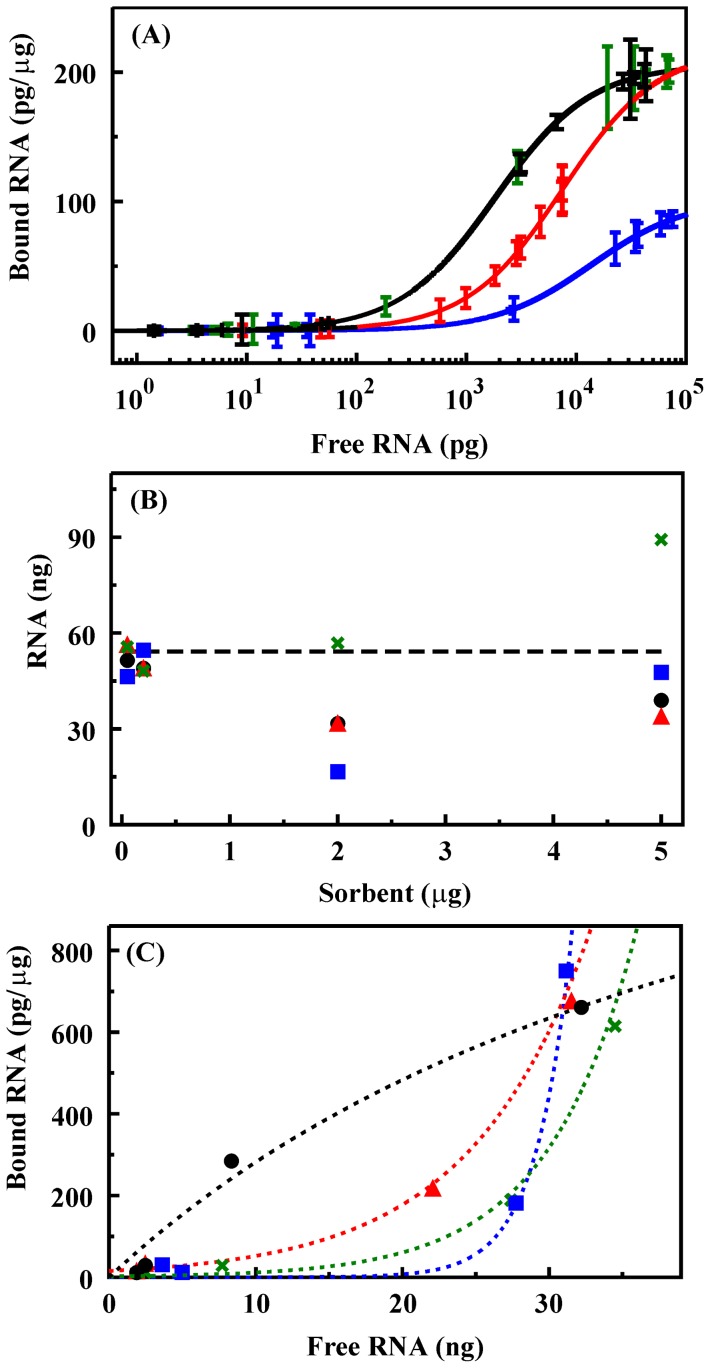
Figure 3. Binding of RNA by silicate materials.
A. Binding isotherms for NS (black line, black symbols), NS-T (black line, green symbols), NS-G (blue), and NS-B (red) determined based on results of RT-PCR. Error bars are the standard deviation in the measurements. B. Comparison of initial RNA concentration to that recovered based on the fluorescence intensities of the supernatant and the solid components of the experiment: applied (dashed line); NS (black), NS-T (green), NS-G (blue), NS-B (red). C. Binding isotherm based on fluorescence intensity of the supernatant: NS (black), NS-T (green), NS-G (blue), NS-B (open circle). Lines are provided to indicate trends and are not representative of fits for this data.

