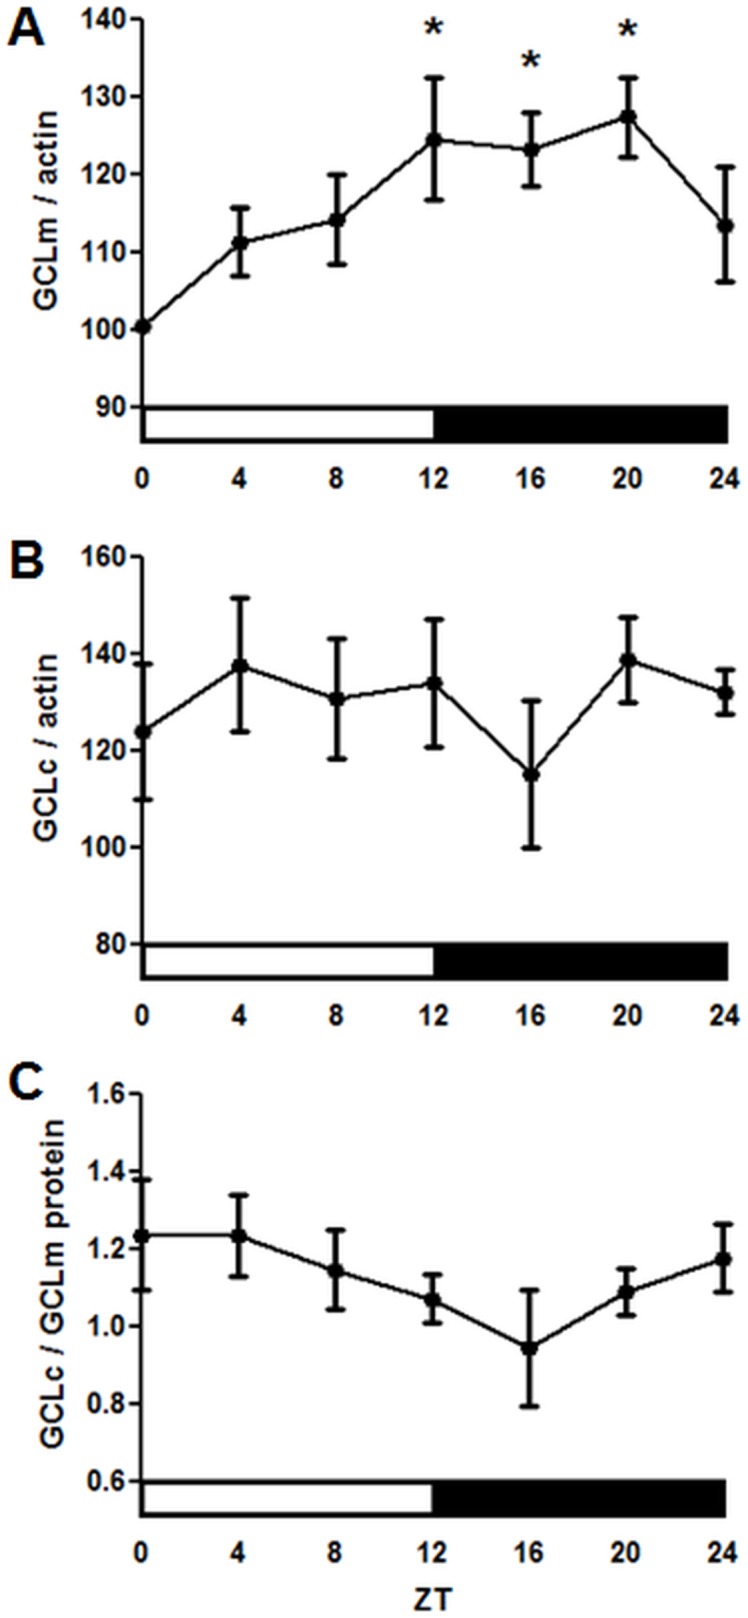
Figure 5. Profiles of GCL proteins and their ratio over the circadian day in the heads of wild type CS males.

(A) GCLm and (B) GCLc protein levels based on average densitometry of signals obtained on Western blots with anti-GCLc or anti-GCLm antibodies normalized to signals obtained with anti-actin antibodies. Each replicate was normalized to the time point with the lowest expression. (C) Ratio of GCLc to GCLm protein over the circadian day in wild type CS males. (A–C) Data represent average values ± SEM obtained from 8 immunoblots performed with 4 independent bio-replicates. Statistical significance was determined by a 1-way ANOVA and Dunnett's post-test as denoted by asterisks (p<0.05).
