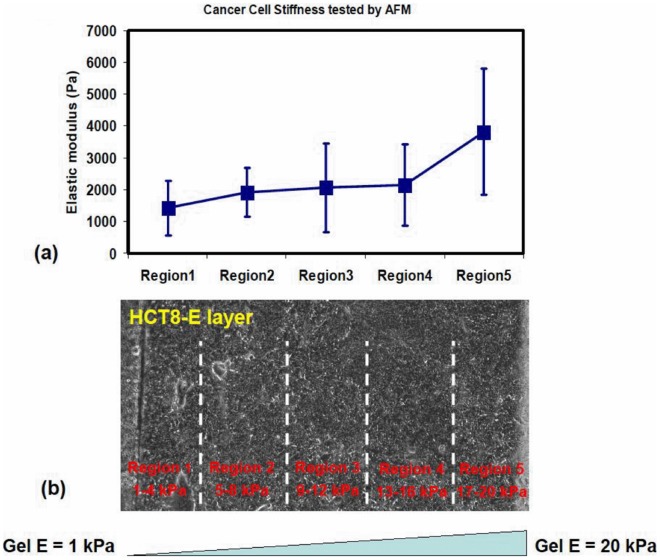
Figure 3. Stiffness and morphology of HCT-8 E cells correlate with substrate rigidity.
Using Atomic Force Microscopy, the stiffness of HCT-8 E cells cultured on the gradient substrate is determined. The HCT-8 E cells increase their cell stiffness as the substrates become more rigid. To facilitate the comparison between different cells on same substrate stiffness, five equal-spaced regions across the entire stiffness range are designated: region 1 covers 1–4 kPa, region 2 covers 5–8 kPa, region 3 covers 9–12 kPa, region 4 covers 13–16 kPa, and region 5 covers 17–20 kPa. (a) From region 1 to region 5, the E cell stiffness progressively increases with values 1.42±0.85 kPa to 1.90±0.77 kPa, 2.06±1.39 kPa, 2.15±1.28 kPa, and 3.82±1.98 kPa, respectively. In contrast, on gel substrates with same stiffness gradient, the post-metastatic R cells show almost invariant cell stiffness. (b) Phase-contrast pictures of HCT-8 E cells on gradient PA substrates.

