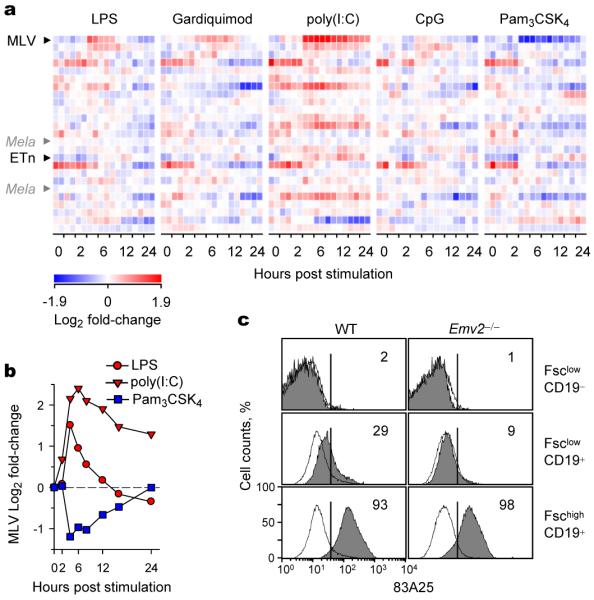
Figure 3. Murine ERV activation by microbial products.

a, ERV/RE-reporting probeset (Supplementary Table 3) signals in a publicly-available Affymetrix HT Mouse Genome 430A microarray dataset20 (E-GEOD-17721) of WT B6 bone marrow-derived dendritic cells following stimulation with microbial products. Black arrows indicate the probesets that are significantly regulated (p<0.05) more than 2-fold by at least one stimulus. Mela (Emv2)-specific probesets are also indicated by grey arrows for comparison. b, Mean log2 fold-change in MLV-reporting probeset in the same dataset. c, MLV SU expression in WT or Emv2−/− splenocytes before (open histograms) and after stimulation with 10 μg/ml LPS for 48 hrs (grey-shaded histograms), according to Forward scatter (Fsc) and CD19 expression. Numbers with the plots denote the percentage of cells within each gate and represent 2 donors each analysed in duplicate.
