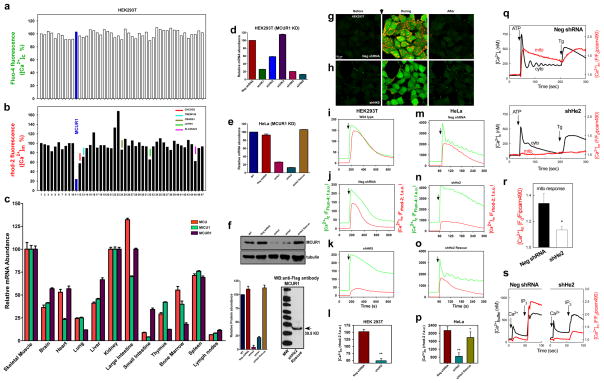
Figure 1. RNAi screen identifies MCUR1 as a regulator of mitochondrial Ca2+ uptake.
Changes in 293T cell cytoplasmic (a) and mitochondrial (b) [Ca2+] in response to ionomycin (2.5 μM) were simultaneously measured by fluo-4 and rhod-2 imaging, respectively. Each bar represents one target gene silenced with pooled siRNA. (c) qRT-PCR of MCU, MCUR1 and MICU1 mRNA from mouse tissues (n=3; mean ± s.e.m). (d) qRT-PCR of MCUR1 mRNA from 293T cell clones (n=3; mean ± s.e.m). (e) qRT-PCR of MCUR1 mRNA from HeLa cell clones and of rescued MCUR1 mRNA levels in shHe2 clone (n=3; mean ± s.e.m). The same lentiviral shRNAs were used to generate shHK4 and shHe1 and shHK5 and shHe2, respectively. (f) (Top) MCUR1 protein expression levels and densitometric analysis (n=3; ± s.e.m.). (Bottom) Flag-tagged MCUR1 protein expression in clone shHe2 cells reconstituted with shRNA resistant MCUR1 cDNA plasmid. (g and h) Representative images from movies of HEK 293T NegshRNA or shHK5 cells showing cytosolic (green) and mitochondrial (red) [Ca2+] before (left), during (middle) and after (right) ionomycin exposure. Scale bar: 20 μm. (i–p) Cytoplasmic (green) and mitochondrial matrix (red) [Ca2+] responses in 293T (i–l) and HeLa (m–p) cells challenged with ionomycin or histamine (100 μM), respectively. (n=3) (i) Wild-type 293T cells. (j) Cells expressing negative shRNA. (k) Clone shHK5 (n=4). (l) Quantification of peak rhod-2 fluorescence. **P < 0.01 (mean ± s.e.m.). (m) HeLa cells expressing negative shRNA. (n) Clone shHe2. (o) Clone shHe2 re-expressing MCUR1 (n=3). (p) Quantification of peak rhod-2 fluorescence. *P < 0.05, **P < 0.01 (mean ± s.e.m.). (q) [Ca2+]c and [Ca2+]m signals evoked by ATP (100 μM) and thapsigargin (Tg, 2 μM) were monitored simultaneously using fura2/AM and mtipcam, respectively in control (upper) and MCUR1 KD (middle) HeLa cells. [Ca2+]c calibrated in nM (black), whereas mtipcam fluorescence is inversely normalized to baseline (F0/F) (red). (r) Summary mean [Ca2+]c and [Ca2+]m peaks during ATP stimulation (negShRNA n=29; MCUR1 KD n=36 cells,. *P < 0.05 (mean ± s.e.m.). (s) Increase in bath [Ca2+] (Rfura2) and [Ca2+]m (Rmipcam) signals in response to CaCl2 (1 μM) and IP3 (7.5 μM) addition in permeabilized cells.

