
Figure 1.
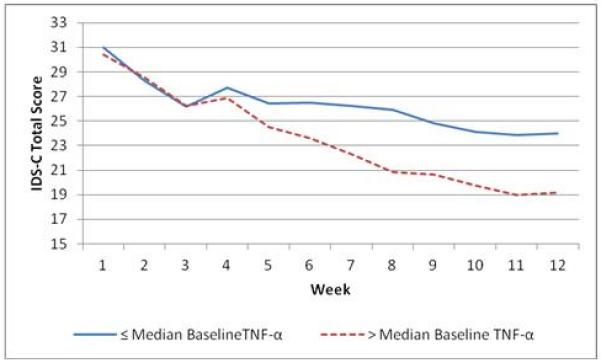
Plot of adjusted Least Squares Means* for IDS-C Total by Week for those above (>) and below (≤) the median baseline TNF-α value of 5.493 pg/mL.
*Least Squares Means were adjusted for Baseline IDS-C, Family History of MDD, Recurrent MDD, Gender, Race, BMI, SF36 Mental, and SF36 Physical and Age.