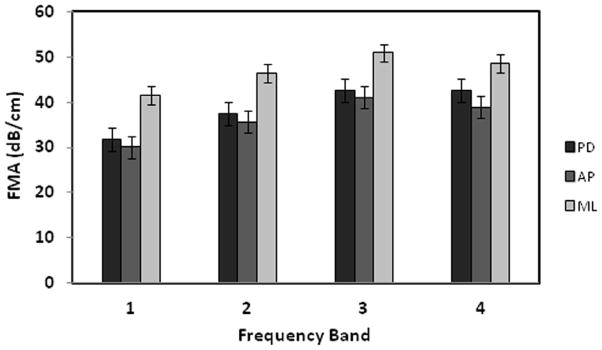
Figure 6.

The means and the standard deviations of the FMA values in four frequency bands (1–4) with the bandwidth of 400 kHz and the center frequencies at 500 kHz, 900 kHz, 1.3 MHz, and 1.7 MHz respectively. The FMA in ML orientation is the highest followed by the FMA in PD and AP orientations.
