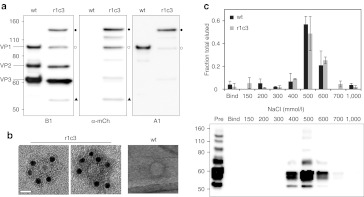
Figure 4.
Physical characterization of r1c3. (a) Western blot analysis of clone r1c3. Staining with B1 (left panel), which binds the C-terminus of VP1/VP2/VP3, shows a typical pattern for wt AAV2. In comparison, B1 staining shows normal VP2/VP3 expression for r1c3 with a higher molecular weight VP1-mCherry hybrid protein (closed circles), confirmed by mCherry (mCh) and A1 staining (middle and right panels, respectively). A fragment sized similarly to wt VP1 was also seen in r1c3 by B1 staining (open circles; left panel), but appears positive for mCherry staining (middle panel). In addition, r1c3 showed a lower molecular weight band (closed triangles) with B1 and mCherry staining that was negative for A1, likely a C-terminal proteolytic fragment. These and additional bands in the blots may indicate mild proteolysis of r1c3, but the full-length VP1-mCherry chimera appears to be the dominant VP1 species. (b) Immunoelectron microscopy of r1c3 demonstrates incorporation of the VP1-mCherry protein into the capsid. Transmission electron micrographs were taken after staining with a polyclonal mCherry antibody followed by a secondary antibody conjugated to gold nanoparticles (12 nm, black dots). Wt AAV2 is shown at right under identical staining conditions. Mutant r1c3 is shown as an empty (left panel) and full (middle panel) capsid, both containing VP1-mCherry chimeric proteins. Bar = 20 nm. (c) Affinity chromatography shows r1c3 retains affinity for heparin, the primary cell surface receptor for AAV2. qPCR analysis (top panel) of eluates with increasing NaCl show wt AAV2 (black bars) and r1c3 (gray bars) both elute in peak fractions near 500 mmol/l NaCl. Error bars indicate SD from three (wt) or two (r1c3) independent experiments. Western blot analysis (bottom panel) of samples run under non-reducing conditions, stained with B1, verifies presence of capsid subunits in elutions. AAV, adeno-associated virus; qPCR, quantitative PCR.

