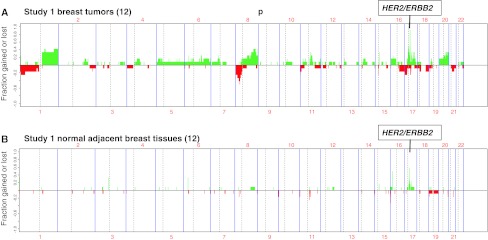
Fig. 1.
Frequency of significant allelic gain (green) or loss (red) based on 20K MIP array platform analysis of 12 paired Study 1 samples, plotted as a function of genomic location, with HER2-positive tumor frequencies shown above (A) and their adjacent normal breast tissue frequencies shown below (B). The 17q chromosome location of the HER2/ERBB2 amplicon is indicated above each panel. Vertical axis labels indicate fraction of samples with gained (0 to +1.0) or lost (0 to −1.0) allelic probes

