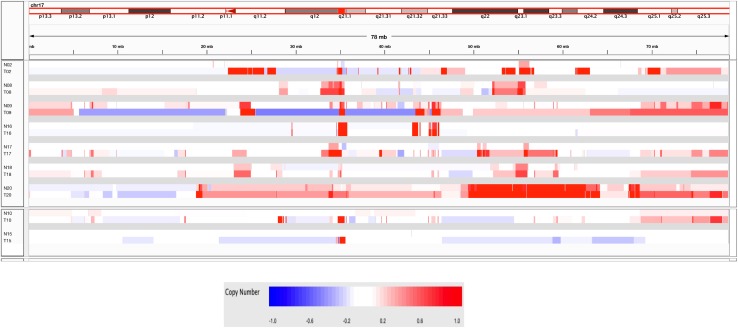
Fig. 4.
IGV display comparing Study 2 chromosome 17 gains/losses and HER2/ERBB2 amplicon gains in the 7 T/N sample pairs for which increased 17q and HER2 copy numbers were seen the N samples (top heatmap panel), and the 2 other sample pairs in which the N samples showed normal chromosome 17 copy numbers but aberrant genomes elsewhere (bottom heatmap panel). Heatmaps show segmented overall copy number variations with red intensities indicating regions of copy number gain, blue intensities indicating regions of copy number loss, and white indicating no copy number change. The HER2/ERBB2 locus is indicated by the red rectangle on the ideogram (~35 mb)

