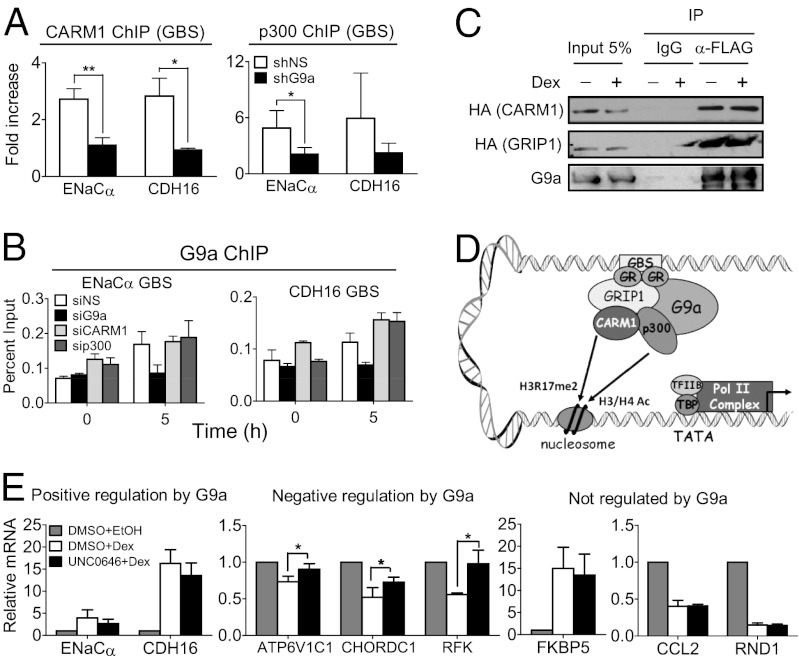
Fig. 4.
G9a facilitates recruitment of p300 and CARM1 for activation of G9a-dependent GR target genes. (A) A549 cells expressing shNS (open bars) or shG9a (filled bars) were treated with dex for 0 or 5 h. ChIP was performed with antibodies against CARM1 (Left) or p300 (Right), and immunoprecipitated DNA was analyzed by qPCR by using primers specific for the GBS of the indicated genes. Results are normalized to input chromatin and the mean ± SD of the ratio between 5 h and 0 h dex treatment for three independent experiments are shown. (B) A549 cells transfected with the indicated siRNA were treated with dex for 0 or 5 h. ChIP was performed with antibody against G9a, and immunoprecipitated DNA was analyzed by qPCR by using primers specific for the GBS of the indicated gene. Results shown are mean ± SD of triplicate PCR reactions performed on the same DNA sample, are from a single experiment, and are representative of two independent experiments. (C) COS-7 cells were transfected with pSG5-2XFLAG-hG9a (full-length) and pSG5-HA-mCARM1 (full-length) or pSG5-HA-mGRIP1 (full-length) and treated with dex for 0 or 4 h. G9a was immunoprecipitated from cell extracts with an anti-FLAG antibody or nonimmune IgG (for background estimation), and bound protein was analyzed by immunoblot with anti-G9a antibody (Lower) to control for levels of immunoprecipitated G9a or with anti-HA antibody to detect CARM1 or GRIP1. A 5% input sample was loaded for comparison. (D) Model for positive G9a-mediated regulation of GR target gene expression. First, hormone-activated GR binds to GBS. Next, G9a is recruited to GBS at least in part through interaction with GR. G9a then facilitates recruitment or stabilizes the association at the GBS of p300 and CARM1 coactivators, which acetylate histones H3 and H4 (H3/H4 Ac) and dimethylate histone H3 at R17 (H3R17me2), respectively, leading to the recruitment of basal transcription factors (TFIIB and TBP) and RNA polymerase II (Pol II) complex. (E) RT-qPCR quantification of mRNA levels for the indicated genes normalized to β-actin mRNA. Cells were treated with 100 nM dex (white and black bars) or the equivalent volume of EtOH (vehicle; gray bars) for 8 h. At 1 h before hormone or EtOH treatment, cells were treated with 2 µM UNC0646 (black bars) or equivalent volume of DMSO (vehicle; white and gray bars). Results shown are mean ± SD for at least three independent experiments (*P ≤ 0.05, paired t test).

