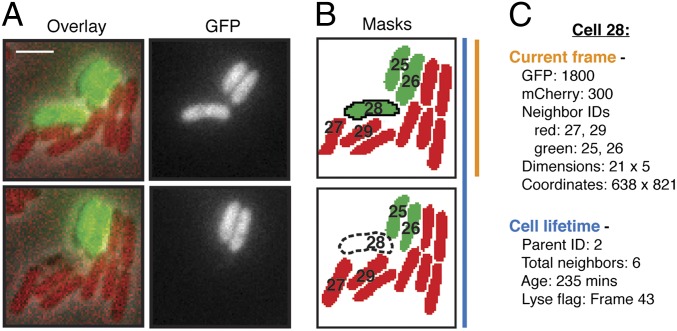
Fig. 1.
Overview of TLFM-based intercellular interaction analyses. (A) Consecutive cropped frames from a typical TLFM experiment in which two populations of differentially labeled cells (B. thailandensis attTn7::gfp and P. aeruginosa attTn7::mCherry) were cocultured and imaged. The overlay includes phase, GFP, and mCherry channels. (Scale bar, 2 μm.) (B) Cell masks generated by image segmentation. Red and green coloring corresponds to distinct subpopulations identified by gating on fluorescence intensity. (Lower) Dashed outline depicts a software-identified lysis event. Hypothetical cell identification numbers are shown. (C) Example of cell-specific values measured during automated analysis. Certain data are recorded once and pertain to the cell lifetime as a whole (blue); other parameters vary between frames (orange).

