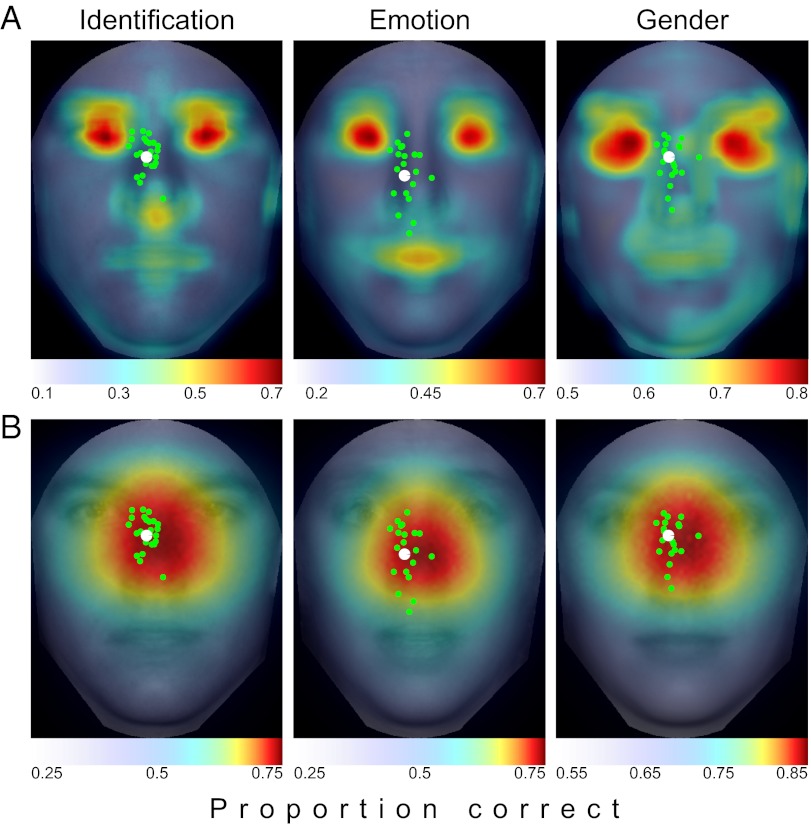
Fig. 5.
ROI and FIO predictions. (A) ROI ideal observer shows heavy concentrations of information in the eye region, with smaller peaks around the nose tip and mouth. Overlaid are the mean saccade landing points for each individual (in green) and the group (in white). Saccades were not directed toward the most information regions. (B) FIO predictions show a peak in the center of the face just below the eyes, where information is optimally integrated across the visual field. The overlaid saccade distributions show a strong tendency for observers to target regions of maximal information gain.

