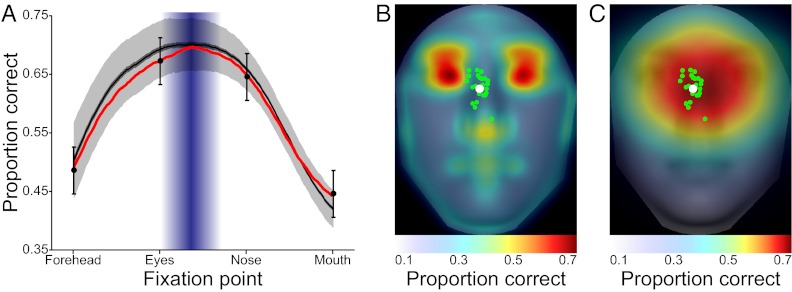
Fig. 6.
NSA. (A) FIO results along the vertical midline for 100 groups of 10 faces each are shown, with dark gray representing the mean performance across groups plus or minus 1 SEM. Light gray represents the SD. (B and C) ROI and FIO results, respectively, show a strong correspondence to the results using images from the human study.

