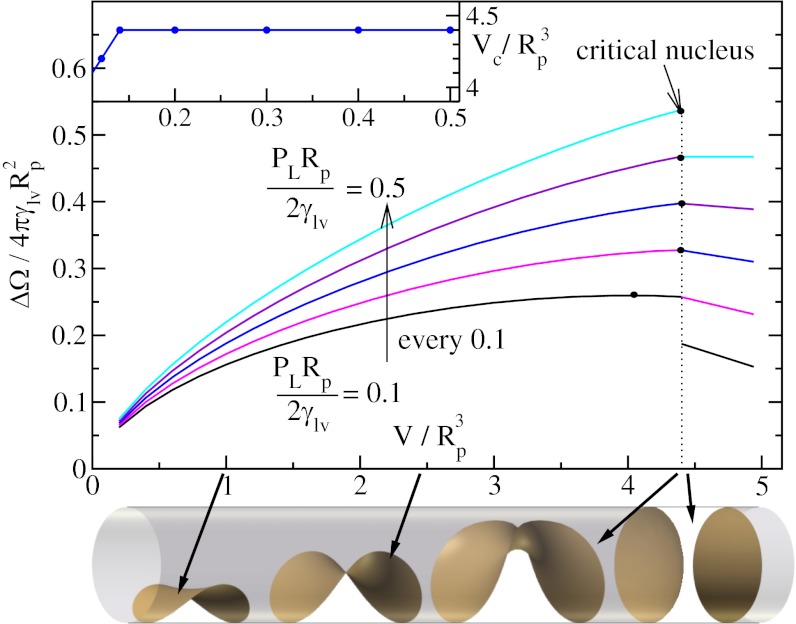
Fig. 4.
Normalized potential energy  of a vapor bubble resting on the wall of a cylinder as a function of its normalized volume
  . The Young’s contact angle is θ = 120o. The different plots correspond to different values of the liquid pressure PL. The shape of the bubble surface is represented for different volumes. At a critical volume Vc, the bubble becomes unstable and spreads over the pore section, forming two disconnected menisci. The maximum value ΔΩc is equal, or very close, to ΔΩ just before instability. (Inset) The reduced critical volume
  as a function of the reduced liquid pressure PLRp/2γlυ.

