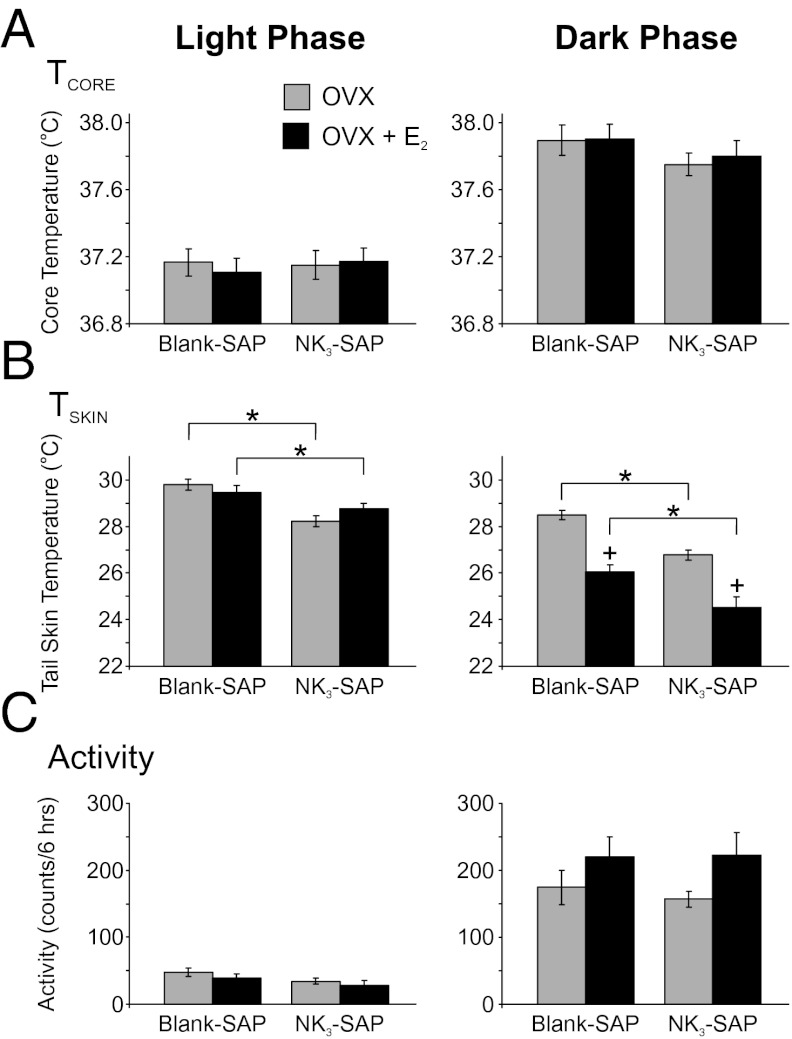
Fig. 3.
Effects of KNDy neuron ablation and E2 treatment on TCORE (A), TSKIN (B), and activity (C) during the light (Left) and dark (Right) phases. (A) Average TCORE was increased in the dark phase (compared with light) in all groups with no significant effect of NK3-SAP or E2 treatment. (B) Average TSKIN was consistently lower in NK3-SAP rats compared with Blank-SAP rats, indicative of lower levels of cutaneous vasodilatation. In the dark phase, TSKIN was decreased by E2 treatment in both Blank-SAP and NK3-SAP rats. (C) Activity (detected by the DSI telemetry probe) was markedly increased in the dark (active) phase, with no significant differences between Blank-SAP– and NK3-SAP–treated groups. There was a trend (P = 0.06) for E2 to increase activity in the dark phase in both Blank-SAP and NK3-SAP rats. Values represent mean ± SEM, n = 6–11 rats per group. *Significantly different (NK3-SAP vs. Blank-SAP, within OVX or OVX + E2). +Significantly different (OVX vs. OVX + E2, within Blank-SAP or NK3-SAP).

