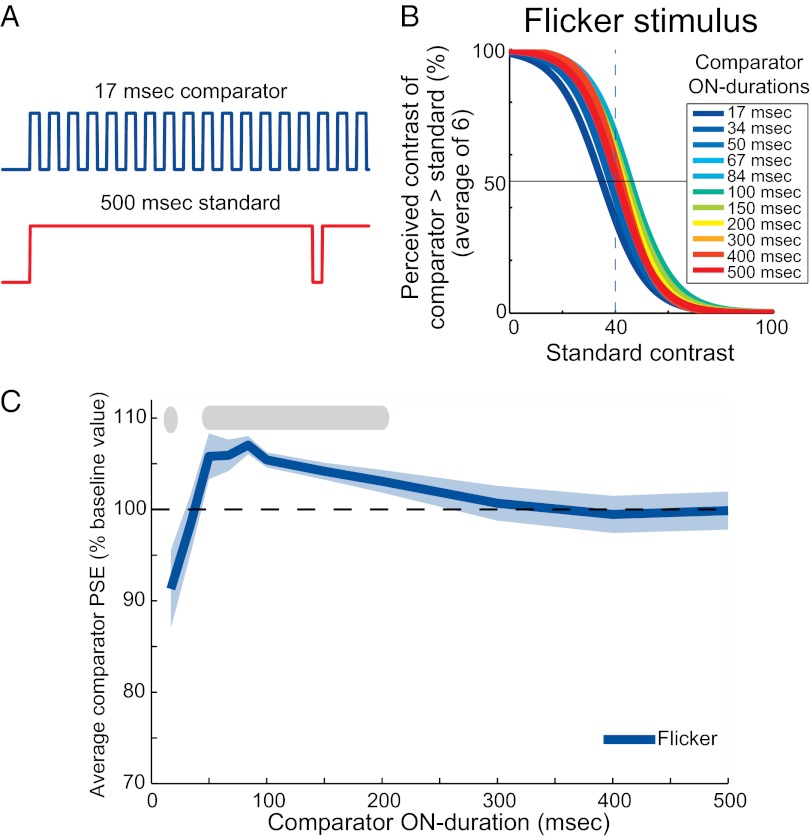
Fig. 3.
Perceived contrast of a flickering stimulus peaks with flash duration. (A) Two sample time courses of the flickering stimuli, with the high level of the square-wave signal representing periods of time during which the stimulus was on and the low level periods of time during which the stimulus was off. Interstimulus interval was kept at 17 ms for all duty cycles, ensuring flicker fusion of all stimuli tested. (B) Average (n = 6) psychometric curves for the conditions having a 500-ms flash length for the standard and a 40% comparator (see Fig. S3 for full breakdown of results by subject). The curves indicate a peak in perceived contrast as a function of increasing flicker duty cycle (Fig. 1 A and D). (C) PSE as a function of the on-time internal to each cycle of flicker (average ± SE from the mean). Perceived contrast peaks for flash durations between 50 and 200 ms. Shaded gray bar indicates the points that differ significantly from baseline.

