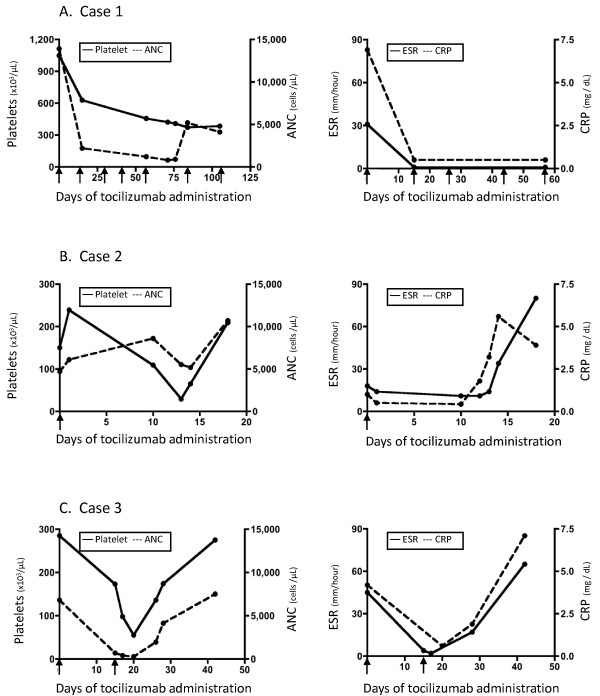
Figure 1.
Laboratory value responses to tocilizumab in Case 1 (A), Case 2 (B), and Case 3 (C). Platelet counts and Absolute neutrophil counts (ANC) (left column), and erythrocyte sedimentation rate (ESR) and C-reactive protein (CRP) levels (right column) from initiation of tocilizumab at Day 0. Arrow indicates dosing of tocilizumab. Note differing x-axis intervals among the three cases.

