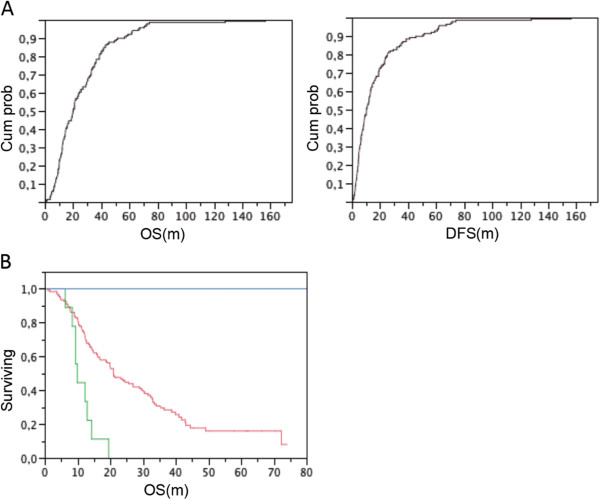
Figure 1.
Classification of PDAC patients based on outcome data. (A) Cumulative curve for overall survival (OS, left) and disease-free survival (DFS, right), based on survival data of all PDAC patients with representative snap-frozen material. (B) Kaplan-Meier overall survival curve of patients respectively from the ‘Good’ (blue) and ‘Bad’ (green) outcome group, in comparison with the non-classified patients (red).

