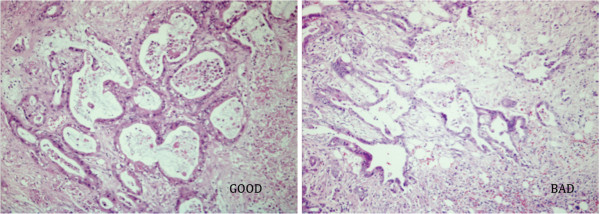
Figure 2.
Pathological features from ‘Good’ and ‘Bad’ patients. Despite distinct survival data, H&E staining on formalin fixed sections from patients from the ‘Good’ outcome group (left) was similar as those from the ‘Bad’ outcome group (right). A representative sample was shown. Original magnification 100x.

