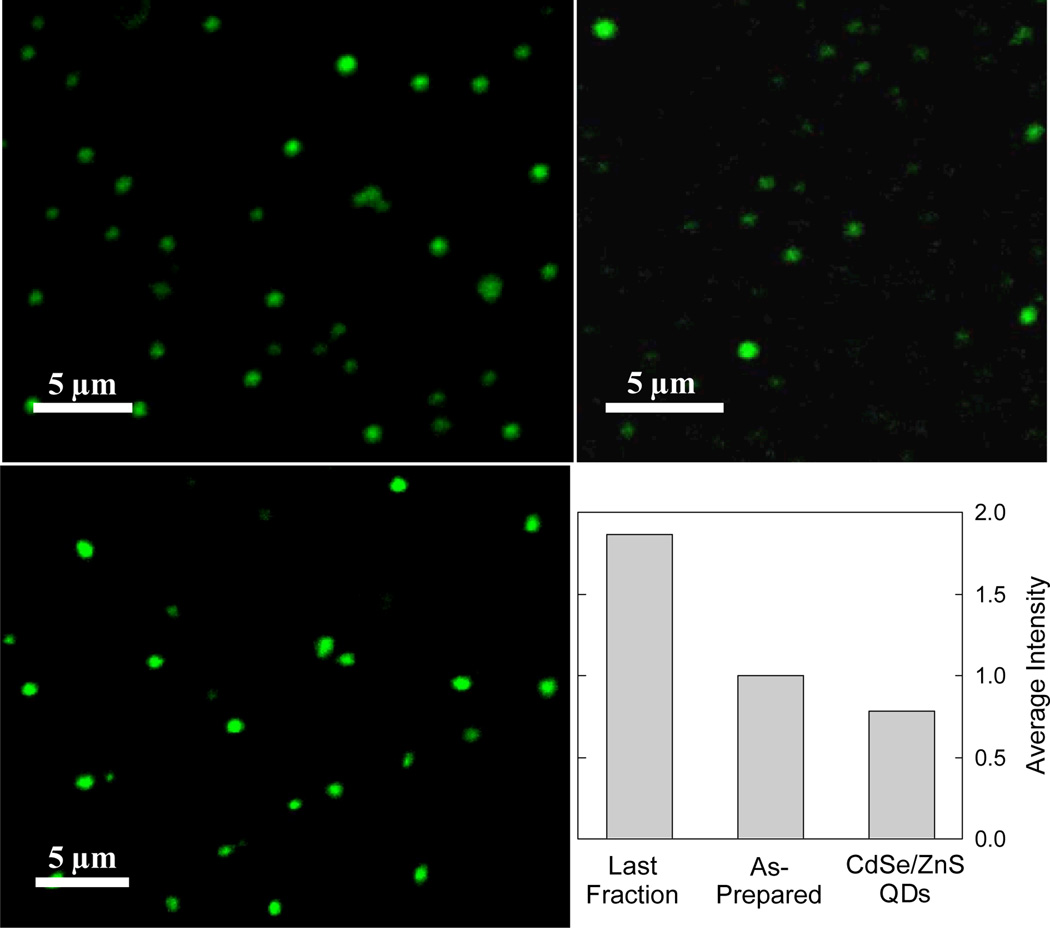
Figure 5.
Fluorescence microscopy images (458 nm excitation) of carbon dots in as-prepared sample (upper left) and in the most fluorescent fraction (lower left), and images of Invitrogen QD525PEG QDs (upper right). The bar-chart comparison was based on averaging 300 most fluorescent dots in each of the three samples.

