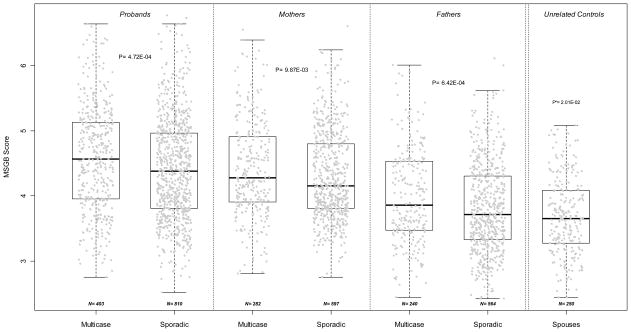
Figure 1. MSGB differentiates multi-case from sporadic MS families.
The distribution of Multiple Sclerosis Genetic Burden (MSGB) is presented using box-plots. MSGB is computed using components derived from gender, MHC and non MHC-SNPs. Gray dots represent the MSGB of an individual subject. Groups separated by dotted lines (probands, mothers of probands, fathers of probands, and unrelated controls) are divided into Multicase and Sporadic samples. Spouses of patients were considered genetically unrelated controls. Sample sizes are indicated at the bottom of each box-plot. P-values in each of the three left panels indicate the significance of Wilcoxon’s tests of the null hypothesis that MSGB of members of multi-case families are greater than those of members of sporadic MS families. The p-value in the right panel corresponds to the test that the MSGB of fathers of sporadic MS patients is different from unrelated controls (Wilcoxon’s test). 186/250 (74.8%) spouses are male; the comparisons remain significant when the MSGB is calculated without the gender component: p= 1.46 10−4 for multi-case probands vs. sporadic probands; p= 1.17 10−6 for sporadic fathers vs. controls.

