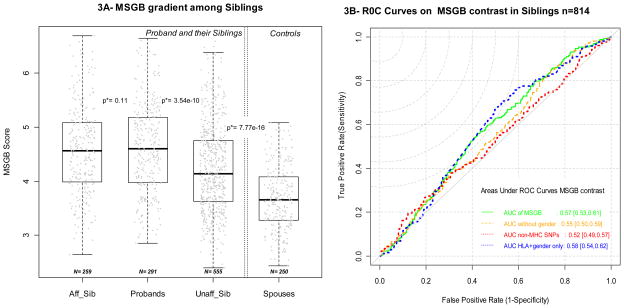
Figure 3. Distribution of MSGB in siblings of MS multi-case families (3A) and informative potential of MSGB contrast (3B).
Figure 3A presents the distribution of Multiple Sclerosis Genetic Burden (MSGB) in siblings using box-plots. MSGB is computed with gender, MHC and non-MHC SNPs components. Gray dots correspond to the MSGB of an individual subject. The three left box-plots of panel A correspond to subject’s status in sibship (“Aff_Sib” = affected sibs, Probands in the middle, “Unaff_Sib” = unaffected siblings). The p-values correspond to Wilcoxon’s tests of the null hypothesis that the MSGB of side by side categories are the same. The box-plot of spouses of probands (controls) is given on the right. When several sibs are available within a group, one is randomly chosen. The p-value overlaying the dotted lines indicates the significance of (unmatched) Wilcoxon’s tests of the null hypothesis that MSGB of unaffected siblings of the probands are greater than the MSGB of the controls.
Figure 3B shows the Receiver Operating Curves (ROC) corresponding to the prediction of MS status of the sibs of the probands based on the contrast between the sib’s MSGB and proband MSGB. In red, MSGB contrasts are computed using the gender and the MHC components. In green, MSGB contrasts are computed using the gender, MHC and non MHC-SNPs components; in orange, MSGB contrasts are computed using the MHC and non MHC-SNPs components. In red, MSGB contrasts are computed using only the non MHC-SNPs components. In blue, MSGB contrasts are computed using only using the gender and MHC.

