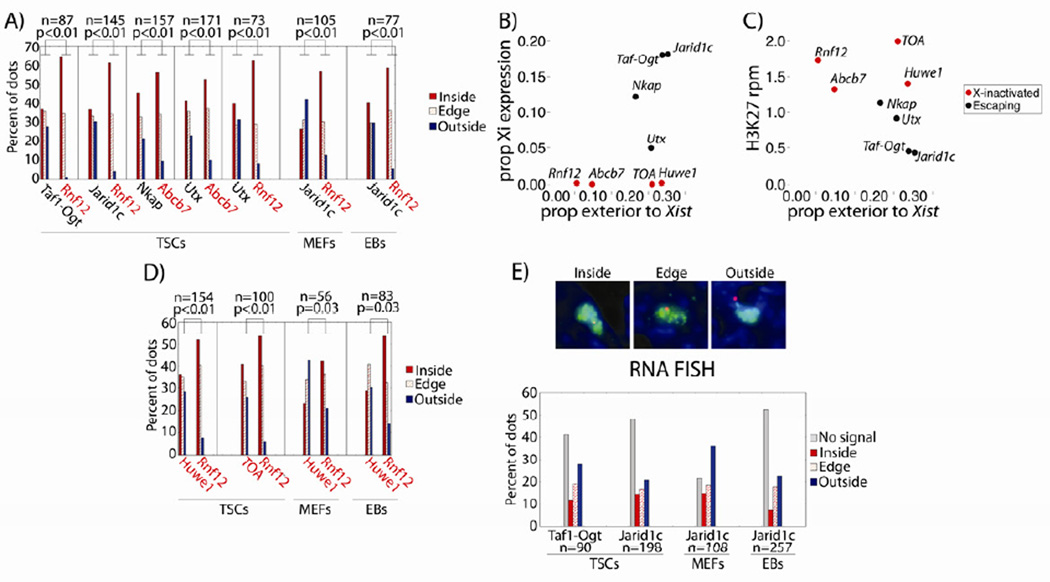
Figure 7. Externalization relative to the microscopic Xist domain does not induce escape.
(A) Gene location relative to Xist domain, by percentage. Vertical lines separate probe pairs of escaping (black font) and X-inactivated (red font) genes. n, Xi’s counted per probe pair. P-values are from χ2 tests comparing dots inside/on the edge of vs. outside the Xi domain.
(B,C) Xist domain externalization frequency vs. (B) Xi expression, or (C) local H3K27me3 density.
(D) Gene location relative to Xist domain, as in (A).
(E) RNA FISH signal relative to Xist domain. ‘No Signal’, mono-allelic expression from the Xa. Representative images are above the bar graph.
See also Figure S6.

