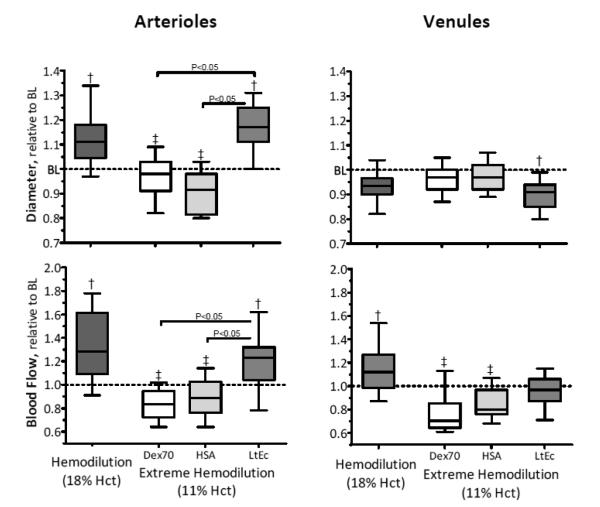
FIGURE 2.
Relative changes to baseline in arteriolar and venular hemodynamics after extreme hemodilution with LtEc, HSA and Dex70. The broken line represents the baseline level. †, P < 0.05 relative to baseline; ‡, P<0.05 compared to Dex70; §, P<0.05 compared to HSA. Diameters (μm, mean ± SD) at baseline in each animal group were as follows: LtEc (arterioles (A): 62.1 ± 7.2, n = 48; venules (V): 62.6 ± 5.8, n = 46); HSA (A: 61.9 ± 9.1, n = 42; V: 63.6 ± 7.2, n = 46); and Dex70 (A: 62.7 ± 8.6, n = 48; V: 64.8 ± 7.4, n = 46). n = number of small blood vessels studied. RBC velocities (mm/s, mean ± SD) at baseline in each animal group were as follows (data was not presented in the figure, but used in the calculation of blood flow): LtEc (A: 4.3 ± 0.9; V: 1.9 ± 0.7); HSA (A: 4.3 ± 1.0; V: 2.0 ± 0.8); Dex70 (A: 4.4 ± 0.8; V: 2.1 ± 0.7). Blood flow (nL/s, mean ± SD) at baseline in each animal group were as follows: LtEc (A: 12.7 ± 5.3; V: 5.4 ± 2.1); HSA (A: 12.4 ± 4.2; V: 5.7 ± 2.1); Dex70 (A: 12.0 ± 4.7; V: 6.2 ± 2.4).

