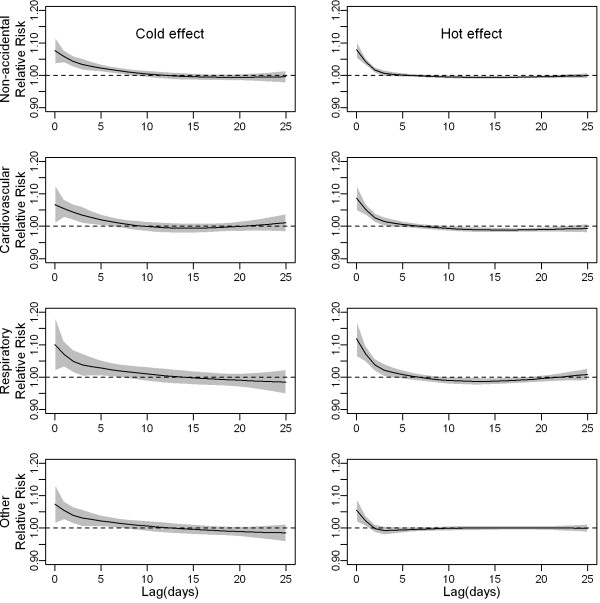
Figure 2.
The effect of mean temperature(°C) on mortality categories along days of lag. The black lines are relative risks of mortality comparing the first to the 10th percentile (cold effect) and the 99th to the 90th percentile (hot effect) of temperatures, and grey regions are 95% confidence intervals.

