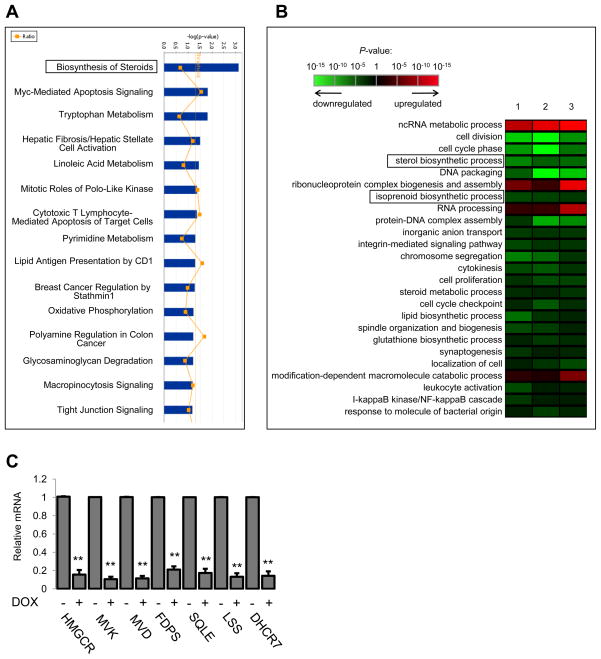
Figure 3. Knockdown of mutant p53 from breast cancer cells in 3D culture significantly downregulates the mevalonate pathway.
(A) Data were analyzed through the use of Ingenuity Pathways Analysis (Ingenuity® Systems, www.ingenuity.com). Blue bars that cross the threshold line (p<0.05) represent pathways that are significantly changed following mutant p53 depletion from MDA-468 cells.
(B) Gene Ontology (GO) analysis. 1, 2, 3 represent three independent experiments. GO terms were sorted based on their significance and redundant terms were discarded.
(C) MDA-468.shp53 cells were grown in 3D cultures for 8 days in the presence or absence of DOX as indicated. qRT-PCR for the 7 sterol biosynthesis genes identified by IPA. Data represent mean ± SD of three independent experiments. **indicates p<0.005 by two-sided t-test.

