Figure 5.
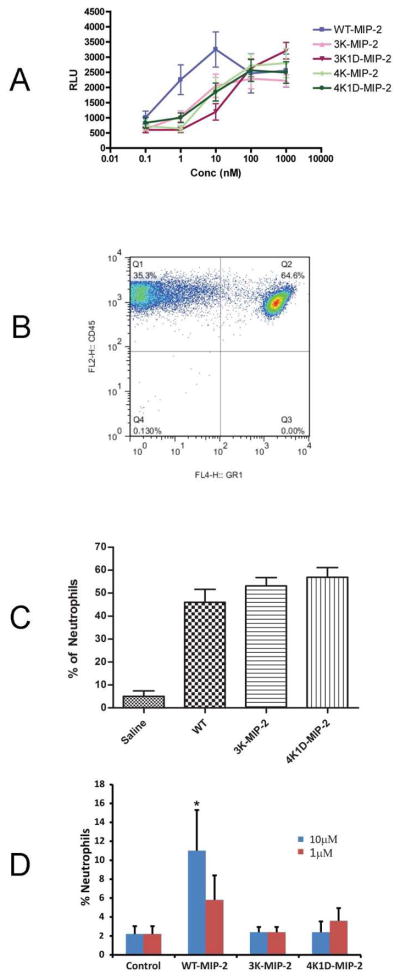
In vitro and in vivo chemotaxis effects of MIP-2 GAG-deficient mutants. A, In vitro chemotaxis of neutrophils in response to WT and MIP-2 mutants at various concentrations. The migrated neutrophils were measured by luminescence represented as relative luminescence unit (RLU). The graph represents the mean of three different experiments done in triplicate (***, p < 0.0001; *, p < 0.01). B, C and D, Effects of GAG-deficient mutations of MIP-2 in vivo. B, Representative FACS analysis of neutrophils (CD45+GR-1+) recruited to the peritoneum in response to 300ng IP injection of WT. C, Percentage of neutrophils recruited to the peritoneum in response to WT, 3K-MIP-2, and 4K1D-MIP-2. D, Percentage of neutrophils recruited in BAL in response to instillation of 1μM or 10 μM of WT MIP-2 or GAG-deficient mutants 3K-MIP-2, and 4K1D-MIP-2. The in vivo data represent the mean number of neutrophils from six female BALB/c mice of 8–10 weeks of age.

