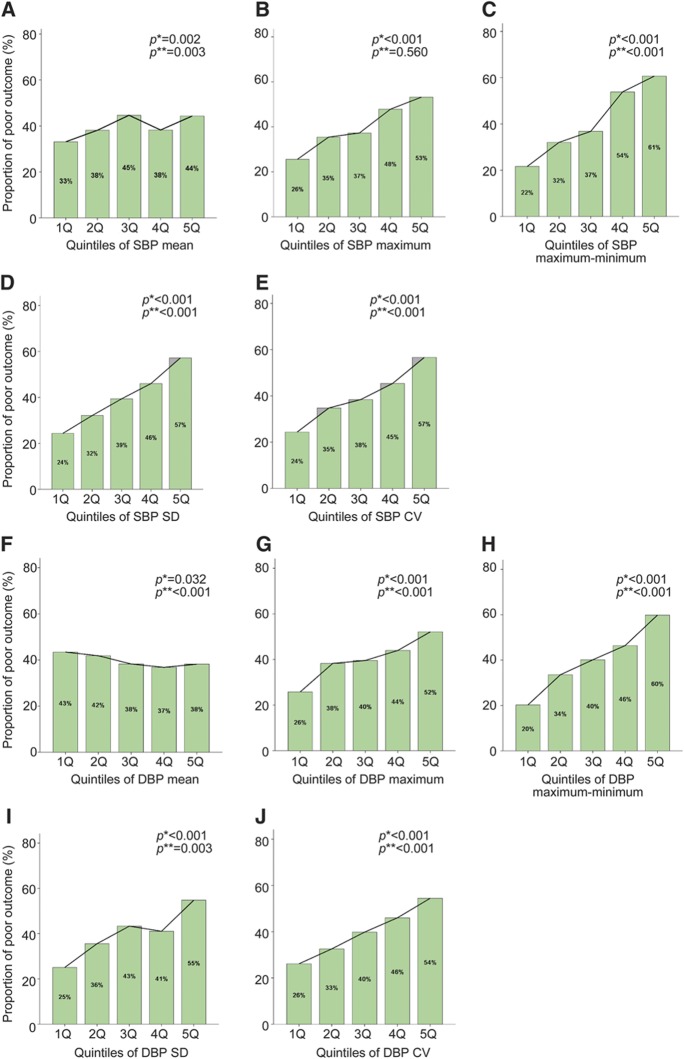
Figure. Proportion of 3-month poor outcome (dark bar) according to the quintiles of blood pressure parameters.
(A) Systolic blood pressure (SBP)mean, (B) SBPmaximum, (C) SBPmaximum−minimum, (D) SBPSD, (E) SBPCV, (F) diastolic blood pressure (DBP)mean, (G) DBPmaximum, (H) DBPminimum, (I) DBPmaximum−minimum, (J) DBPSD, and (K) DBPCV. p Values are for χ2 *linear trend test or for †likelihood ratio test for trend adjusted by age, sex, history of stroke, history of hypertension, baseline National Institutes of Health Stroke Scale score, stroke subtype, diabetes mellitus, atrial fibrillation, SBPmean at acute stage, and time from onset to discharge. CV = coefficient of variation.

