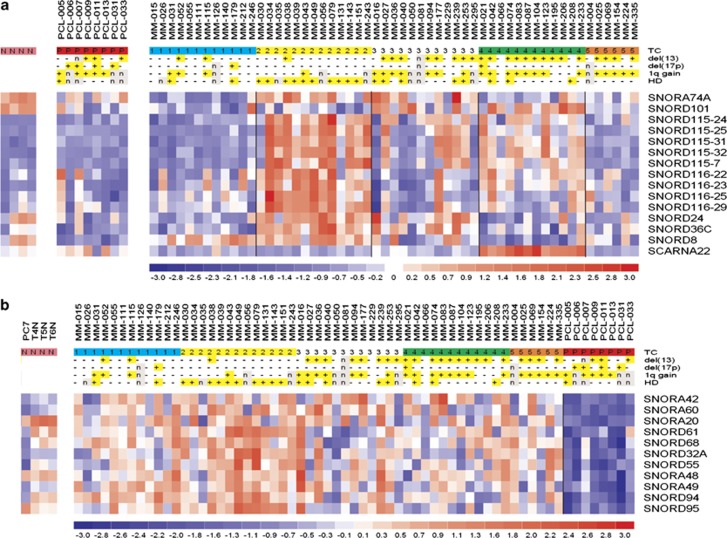
Figure 2.
Identification of sno/scaRNA signatures characterizing distinct MM genetic subgroups. (a) Heatmap of the differentially expressed sno/scaRNAs in MM patients stratified into the five TC groups; sno/scaRNA expression levels in sPCLs and CD138-positive cells from tonsils are shown on the left. (b) Supervised analyses identifying the snoRNAs that are differentially expressed in MM and sPCL patients; sno/scaRNA expression levels in CD138-positive cells from tonsils are shown on the left.

