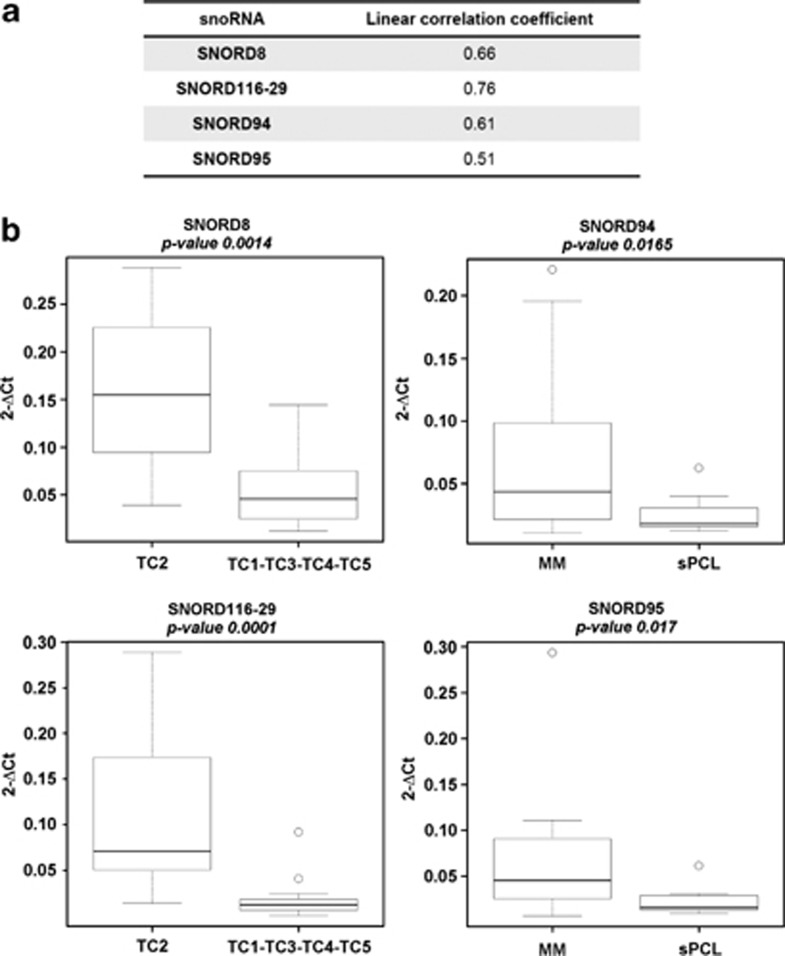
Figure 3.
QRT-PCR validation of snoRNA expression. For each snoRNA, the Pearson's correlation coefficient was calculated between gene expression profiling data and QRT-PCR results expressed as 2−ΔCt (a). Box plots of snoRNAs quantified in QRT-PCR in 33 MM-PCL cases, whose expression significantly correlated to group membership on the basis of Wilcoxon rank-sum tests (P-values are shown above each panel). (b) The expression levels are represented as 2−ΔCt.

