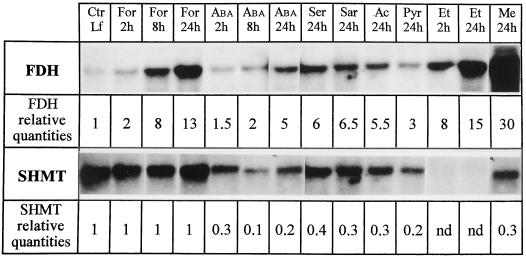
Figure 5.
RNA expression of FDH and SHMT after spraying leaves with various metabolites. Each lane was loaded with 10 μg of RNA. Ctr Lf, Control leaves (water); For 2h, For 8h, and For 24h, 2, 8, and 24 h after 10 mm formate application, respectively; ABA 2h, ABA 8h, and ABA 24h, 2, 8, and 24 h after spraying 100 μm ABA, respectively; Ser 24h, 24 h after 10 mm Ser application; Sar 24h, 24 h after spraying 10 mm sarcosine; Ac 24h, 24 h after spraying 10 mm acetate; Pyr 24h, 24 h after spraying 10 mm pyruvic acid; Et 2h and Et 24h, 2 and 24 h after spraying 10% ethanol, respectively; and Me 24h, 24 h after spraying 20% methanol. The autoradiographs were scanned using the control leaf sample as the reference for both probes, and the figures were corrected according to the RNA loadings.

