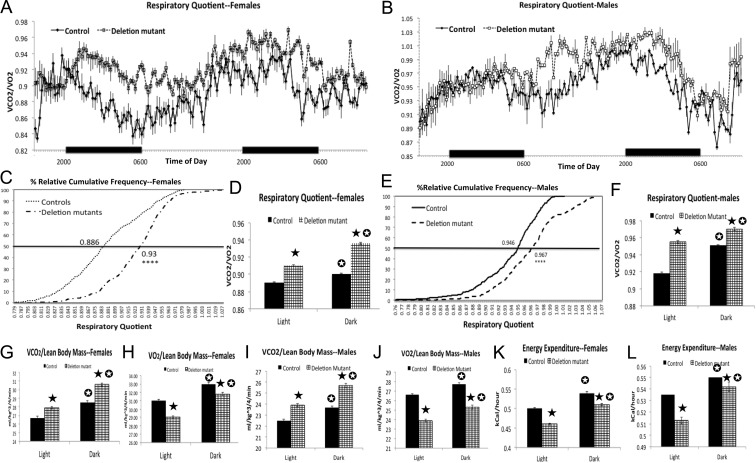
Fig. 2.
Indirect calorimetry in four sets of males and females (16 animals/set) showing changes in RQ (RQ = VCO2/VO2), VCO2, VO2, and energy expenditure. A–F, Deletion mutants have higher RQ, especially during the nighttime feeding cycle with females. C and E, Higher EC50 of individual RQ values is shown on the percentile curve after the use of the percent relative cumulative frequency approach (D'Agostino and Pearson omnibus normality test P < 0.0001; Mann-Whitney t test, P = 0.01, males, and P = 0.024, females). Statistics in the remaining figures were done with the t test with Welch's correction and the InSTAT3 software (GraphPad). D and F, There is higher RQ in both night and day cycles (P < 0.0001). G and I, The higher RQ is due to higher VCO2/lean body mass, averaged for light and dark periods (P < 0.0001). Figures 2 h and 2jH and J, The higher RQ is also associated with a lower VO2 averaged for light and dark periods (P < 0.0001). K and L, Illustration of the lower energy output averaged during light and dark phases (P < 0.0001). Closed star, Significantly greater than control values; open star, significantly different from values in light phase.

