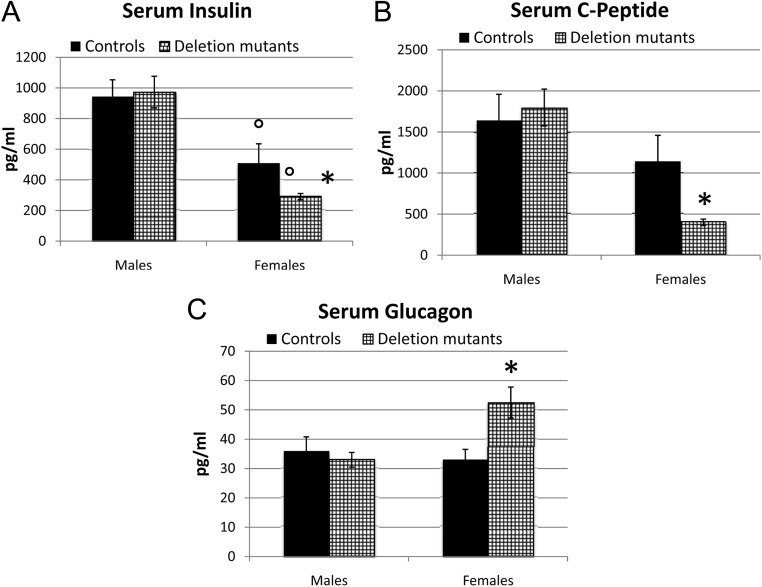
Fig. 4.
Serum levels of insulin, C-peptide, and glucagon. The statistical analysis was done by one-way ANOVA followed by Newman-Keuls and Bonferroni's multiple comparison tests. Figure 4a A, Both sets of females had lower insulin than either group of males (34 control and 36 deletion mutants) (P < 0.0001, Bonferroni). In addition, insulin levels in the 36 deletion mutant females were reduced in comparison with the 30 control females (P < 0.0001, Bonferroni). B, Only the deletion mutant females showed a significant reduction in C-peptide (P = 0.0001, Bonferroni). C, Only deletion mutant females expressed higher serum glucagon (P = 0.0028, Bonferroni). *, Significantly different from controls; °, significantly different from male groups.

