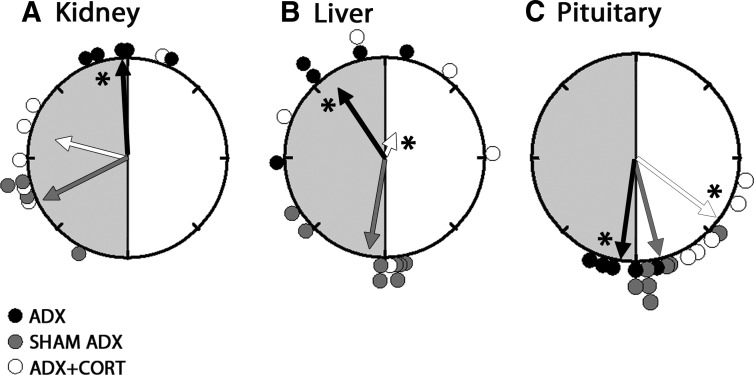
Fig. 1.
Rayleigh plots of the peak phases of Per1-luc in kidney (A), liver (B), and pituitary (C) from ADX (black circles), sham-operated (gray circles), and ADX animals receiving hydrocortisone treatment (white circles). The light and dark portions of the animals' day before euthanasia are indicated with white and gray shaded halves of the circles, respectively. The arrows represent the mean vectors for circular distributions. The length of the vector represents the strength of the phase clustering, and the angle of the vector represents the mean vector phase. Asterisk represents the significance at P < 0.05 level for the F-test compared with sham controls. Adrenalectomy altered the mean phase in liver, kidney, and pituitary, compared with sham controls. Hydrocortisone treatment to ADX animals advanced the phase in pituitary (P < 0.05) whereas it restored the phase in kidney compared with sham controls (P > 0.05). Hydrocortisone treatment caused desynchrony of Per1-luc expression in liver (Rayleigh test, P > 0.05). CORT, Hydrocortisone.

